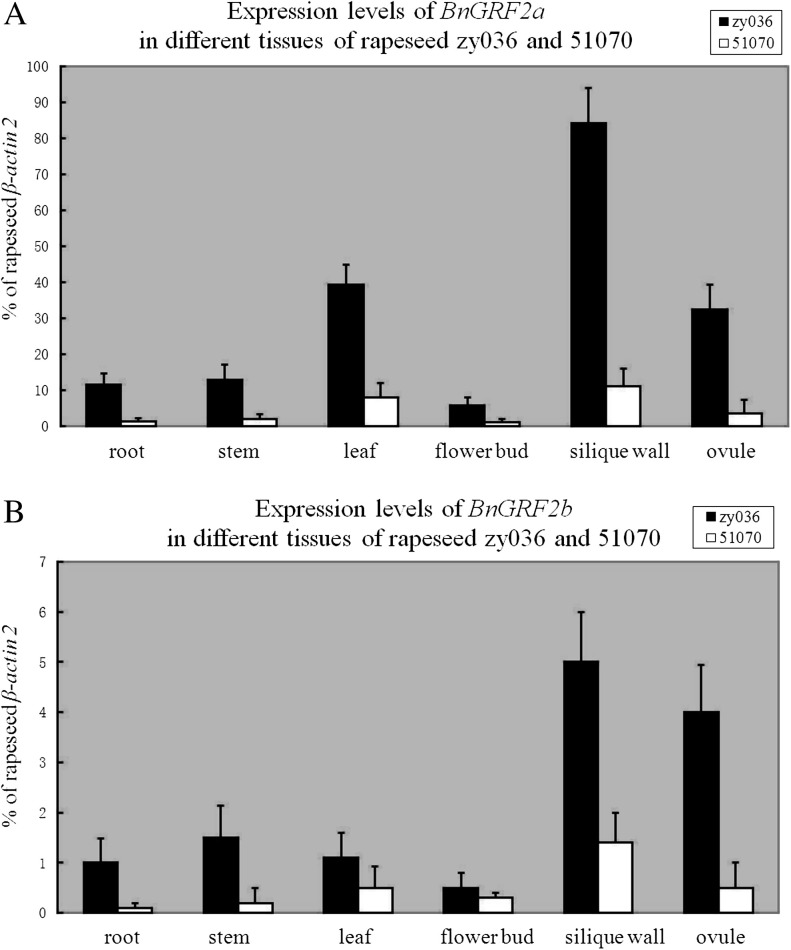
Fig. 2.
Real-time PCR analyses of the BnGRF2 gene in different tissues (root, stem, leaf, flower bud, silique wall, and ovule) between rapeseed lines zy036 and 51070. (A) Expression analyses of BnGRF2a. (B) Expression analyses of BnGRF2b. Data expression was normalized to rapeseed β-actin2, and expression levels of BnGRF2 were compared with that of β-actin2. Data presented are mean values of three biological replicates, and error bars represent standard deviations.

