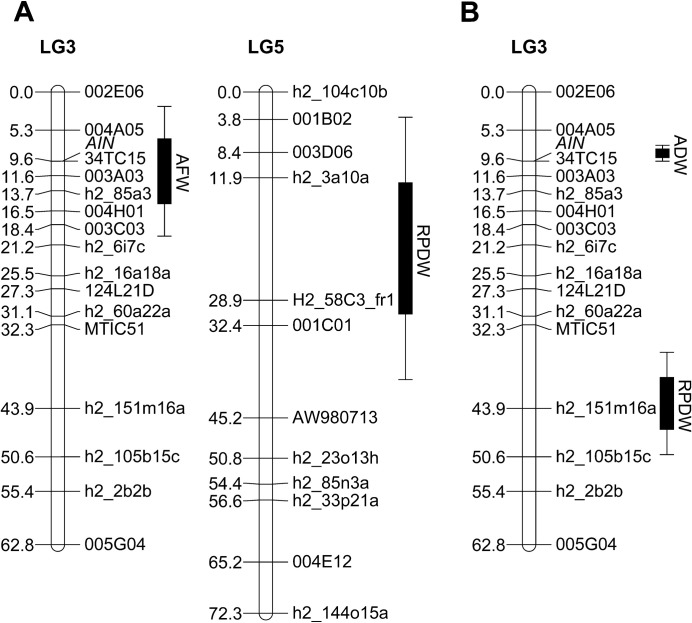
Fig. 5.
Genetic map positions of QTLs involved in resistance to PA (A) and BGA (B) based on phenotype data for 87 and 93 individuals of a recombinant inbred line (RIL) population of A17×A20, respectively. Interval distances are listed in centiMorgans. The genomic locations of the QTLs are depicted on the right of a linkage group (LG), with standard deviations depicted by lines on either side. AFW, pea aphid fresh weight; RPDW, relative reduction of plant dry weight; ADW, bluegreen aphid dry weight.

