
Figure 3.
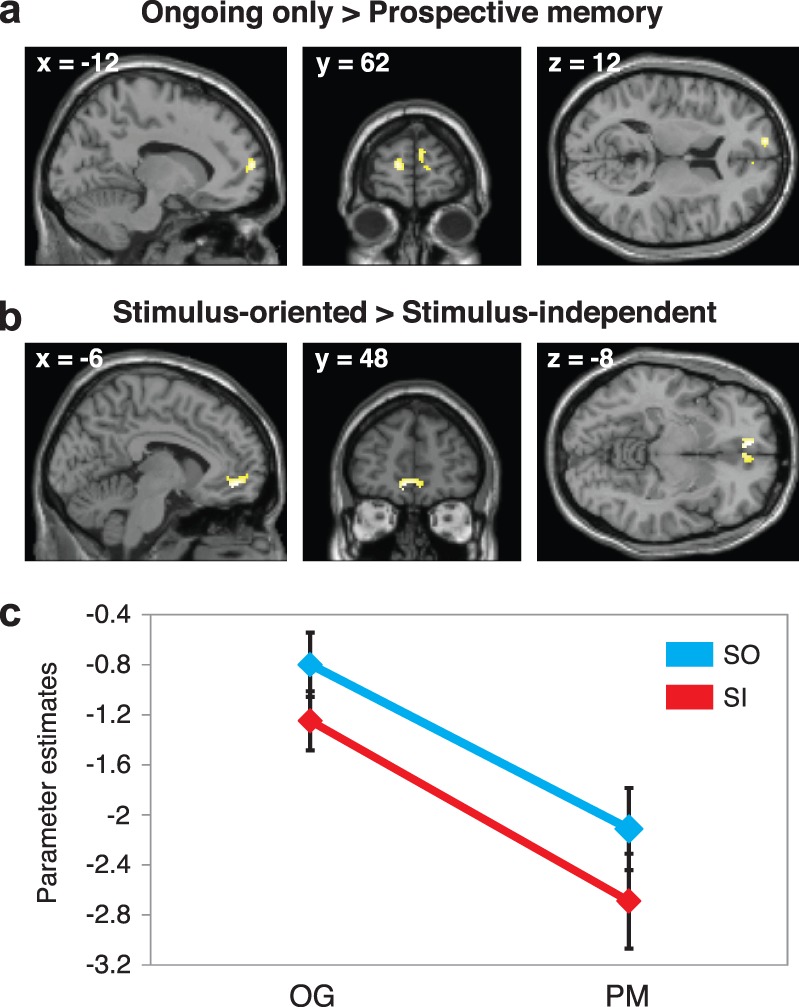
(a,b) BOLD signal changes within rPFC (thresholded at P < 0.05, FWE corrected for BA 10). (c) Parameter estimates from the peak of overlap between a and b. Error bars indicate standard error of means. OG, ongoing only; PM, prospective memory; SO, stimulus-oriented; SI, stimulus-independent.