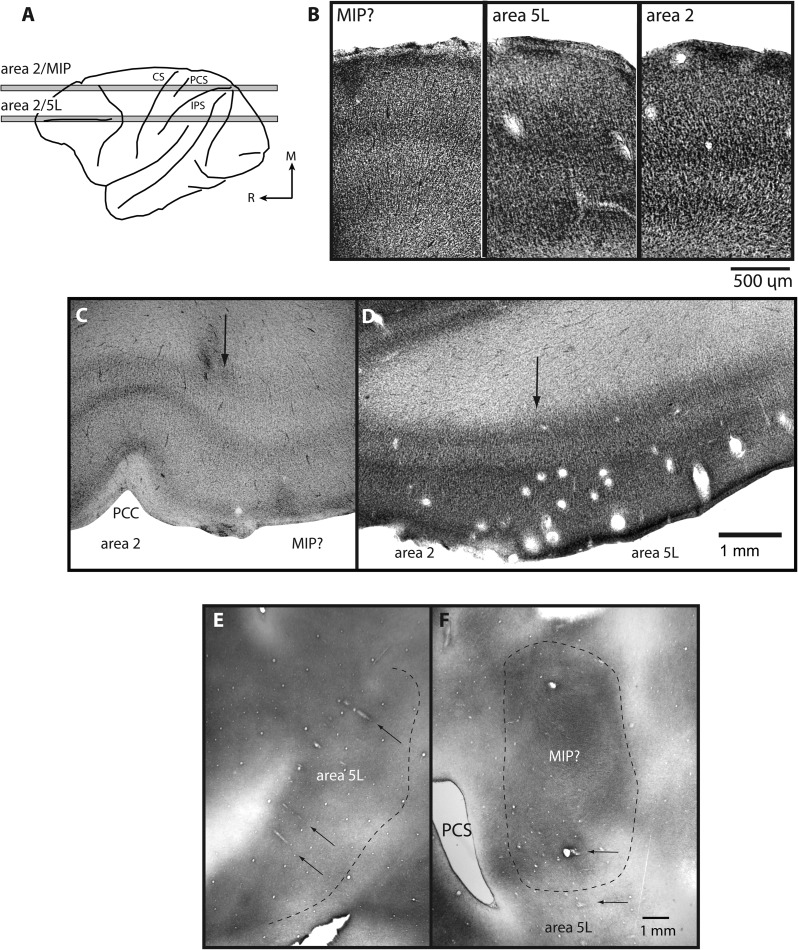
Figure 3.
A dorsolateral drawing of the brain (A) showing the locations from which sections B–D were taken (gray bars). (B) High-powered images of cortex sectioned horizontally and stained for Nissl allow for a direct comparison of the laminar organization of areas 2, area 5L, and the presumptive area MIP. (C) The area 2 and presumptive MIP border are characterized by a dramatic decrease in cell density of layers IV and VI in MIP? as well as a thickening of these layers. (D) The area 2/5L boundary is characterized by a slight decrease in density and a thickening of layers IV and VI. These differences are not as distinct as those between the borders of area 2 and MIP?. In the flattened preparations that have been stained for myelin (E and F) some of the borders of areas 5L and MIP are visible. However, the entire series of sections is used to determine all of the boundaries of these fields. This type of preparation allows much of the length of individual recording tracks within the IPS to be readily appreciated (black arrows). Cortical field boundaries are marked by an arrow in C and D and with a dashed line in E and F. Photomicrographs were taken from cases 01-45 (F); 03-141 (D); 04-51 (B: area 2); 04-53 (B: MIP? and C); 05-82 (E); 05-116 (B: area 5L). Conventions as in previous figures.

