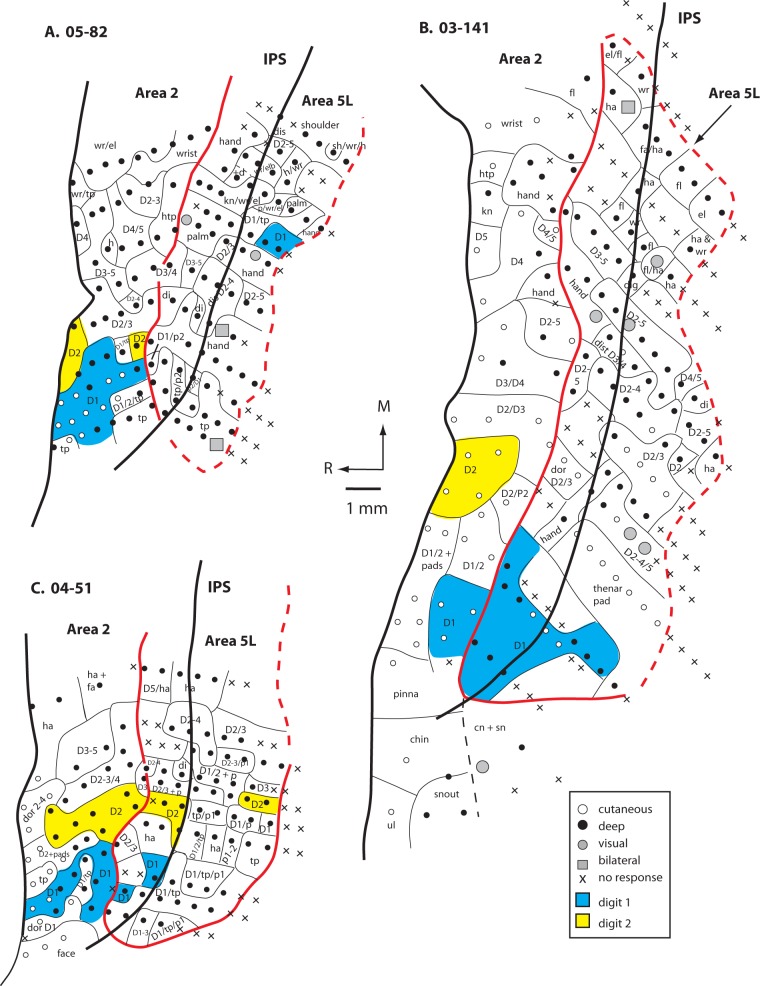
Figure 5.
Maps of area 5L and portions of area 2 generated from electrophysiological recordings in the 3 cases (A. 05-82, B. 03-141, and C. 04-51). In these cases, most of the neurons in area 5 were responsive to stimulation of deep receptors of the skin, muscle, and joints (closed circles). In 2 cases, there were a few sites in which neurons responded to visual stimulation (A and B; gray circles) and in 2 cases, neurons had bilateral receptive fields (A and B; gray squares). The topographic organization of area 2 could be readily discerned, but in area 5L, the same body part was represented multiple times and was encompassed in different receptive field configurations. Furthermore, only the forelimb, and not the head or trunk, was represented in area 5L. Also, there was a greater degree of variability in map organization between individual cases in area 5L compared with area 2. The representations of digits 1 (blue) and 2 (yellow) are highlighted so that direct comparisons can be made between areas 2 and 5L. Area 2 has distinct individual representation of both D1 and D2 while this is variable in area 5L. Most often these digits are represented with other digits rather than individually in area 5L. Thick solid and dashed lines indicate architectonic borders and thin lines separate different body part representation with each cortical area. The red outlines area 5L. The IPS is denoted as a thick black line that runs through area 5L in the mediolateral plane. Other conventions as in previous figures.

