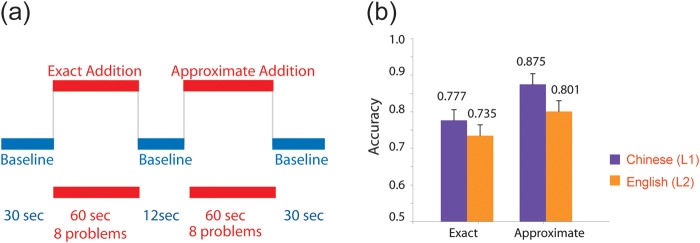
Figure 1.
Experimental paradigm used in the present study and the behavioral performance. (a) Schematic diagram shows one example fMRI run. Each run contained two 60 s activation blocks, interleaved with a 12 s baseline block. There were baseline periods (30 s) at the beginning and end of each run. (b) Behavioral performance (percent accuracy) obtained during the fMRI scans in the scanner. Error bars indicate one standard error of the mean.

