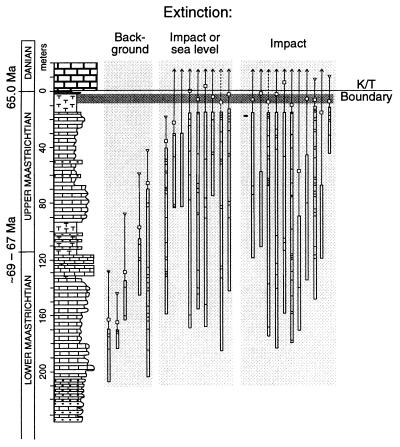
Figure 2.
Graph of the observed temporal ranges of 28 species of ammonite and the positions of the individual fossils (short horizontal dashes). Observed ranges underestimate true ranges due to the incompleteness of the fossil record. This incompleteness can be accommodated by placing a representative gap (confidence interval) on the end of the ranges. The 50 and 95% confidence intervals are represented by small squares and inverted triangles, respectively, or where they extend well above the K/T boundary by arrows. Each species can be placed in one of three categories: (i) it became extinct well before the K/T boundary (the 95% confidence intervals fall well short of the boundary), a victim of so-called background extinction; (ii) it became extinct at the K/T boundary or during a major drop in sea level shortly before the boundary (represented by the stippled horizontal band); or (iii) it became extinct at the K/T boundary. Species in this third category are all found in the last 1.5 m of the Cretaceous (fossil positions not shown). The method used to calculate confidence interval assumes random fossilization. Some key aspects of the analysis are not discussed here; for further details see reference ref. 8.

