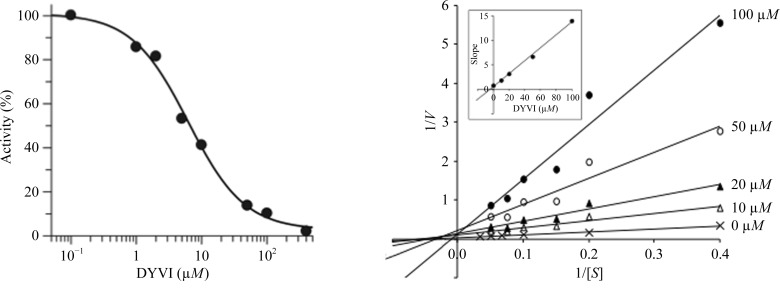
Figure 5.
Inhibition of LmCS by the synthetic peptide DYVI. (a) Dose-response curve. Initial rates were determined in reactions containing 3 mM OAS and eight different concentrations of the peptide DYVI (0.1–400 µM). The graph shows percentage activity plotted against concentration of the peptide and the IC50 curve fitted with GraFit 5. (b) Double-reciprocal plots of initial velocity against substrate concentration showing competitive inhibition. Reactions contained four different concentrations of the peptide (10–100 µM) with six different concentrations of the substrate OAS (2.5–20 mM). Lines were plotted for each peptide concentration by linear regression using Microsoft Excel. Reactions contained 100 µM DYVI (closed circles), 50 µM DYVI (open circles), 20 µM DYVI (closed triangles), 10 µM DYVI (open triangles) or no inhibitor (crosses). The inset is the secondary plot of slope values against the concentration of DYVI.

