Fig. 5.
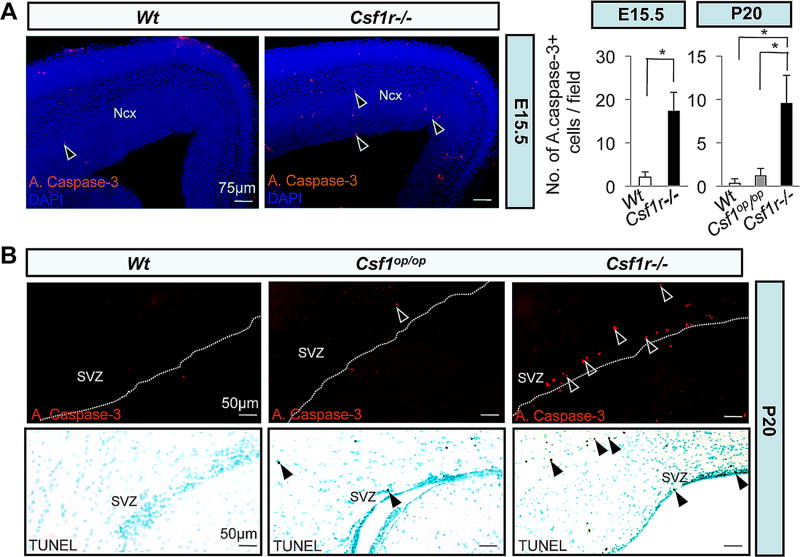
Cellular apoptosis in the developing Csf1r−/− neocortex. (A, B) Photomicrographs of active caspase-3+ (red dots) (A) and (B, upper panels) as well as TUNEL+ (brown dots) (B, lower panels) apoptotic cells in the SVZ/VZ region of E15.5 (A) and P20 (B) Wt and mutant mice. Arrowheads in (A, B) indicate apoptotic cells. Counterstained with DAPI (A) and hematoxylin (B). Dotted lines in (B) delineate the ventricular lining. Quantitation of the number of active caspase-3+ apoptotic cells/field. Means ± SD of ten different representative low-power (20X) fields per region per genotype from three different mice per genotype; *, P<0.001.

