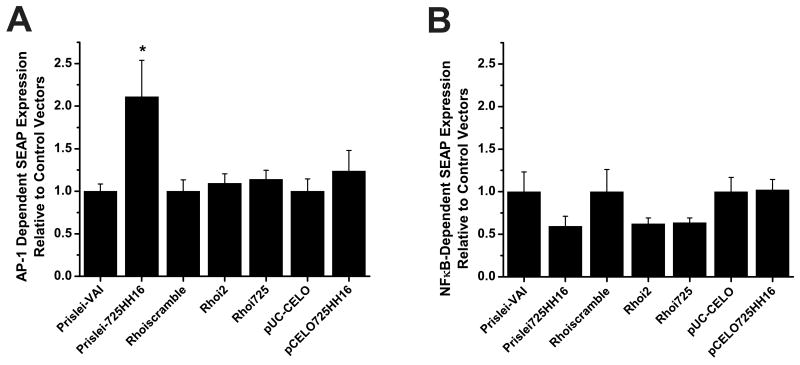
Fig. 5. NFκB and AP1 Activation by PTGS Agents Compared to Activation by Control Vectors.
The increase in AP1-1- and NFκB-dependent SEAP expression by the PTGS agents was examined relative to the SEAP induction produced by their respective control vectors. Here, data for the respective comparisons was normalized to the mean value of the appropriate corresponding control. (A) AP1 testing (t-tests: Prislei vectors t= 2.53582, p = 0.01708; Rhoi2 vs Rhoiscramble t = 0.54065, p = 0.59303; Rhoi725 vs Rhoiscramble t= 0.82301, p = 0.41679; CELO vectors t= 0.8454, p = 0.41035), (B) NFκB testing (t-tests: Prislei vectors t= -1.555 p= 0.131; Rhoi2 vs Rhoiscramble t= -1.397 p= 0.173; Rhoi725 vs Rhoiscramble t= -1.483 p= 0.148; CELO vectors t= 0.101 p= 0.920). * denotes a significant increase in SEAP expression relative to the respective control vector (p ≤ 0.05).

