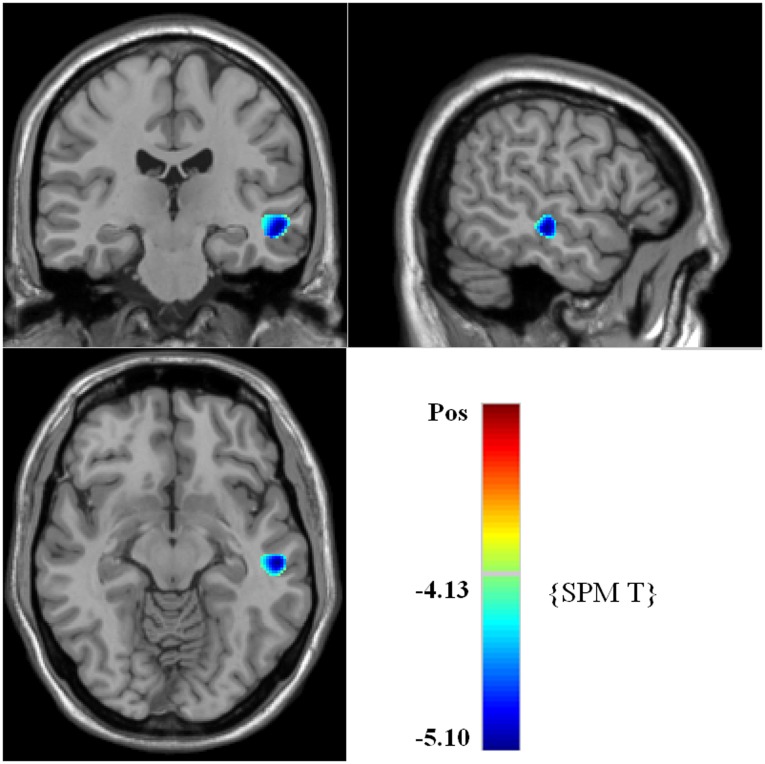
Figure 1. Brian maps of representative axial slices showing the differences of gray matter volume between patients with EOS group and control groupa,b.
a Voxels of reduced gray matter volume in left middle and superior temporal gyrus (with blue colour) in 29 First-Episode early-onset Schizophrenia (EOS) patients revealed by SPM5 analysis. Numbers indicate Montreal Neurological Institute z-coordinates. b Cluster size is in voxels. All clusters shown exceed a FDR corrected statistical threshold of cluster-level P<0.05 and a cluster size threshold of 100 consecutive voxels.

