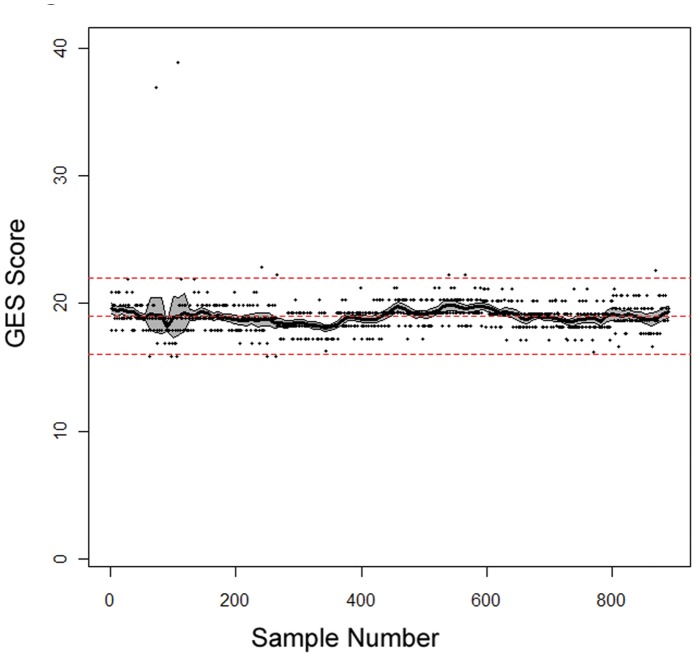
Figure 4. Mean Deviation of GES from Target Score Across the Course of the Study.
Solid black line = running mean deviation of GES across the 895 samples (x axis, chronological order samples were run; y axis, GES). Middle dashed line = target GES; upper and lower dashed lines = QC boundaries ±3 points target GES. 95% CI = grey area.

