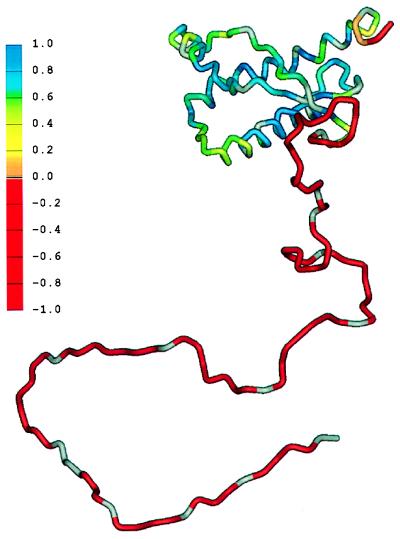
Figure 1.
Schematic diagram showing the flexibility of the polypeptide chain for PrP(29-231). The structure of the portion of the protein representing residues 90–231 was taken from the coordinates of PrP(90-231) (17). The remainder of the sequence was hand-built for illustration purposes only. The color scale shows the heteronuclear [1H]-15N NOE data, from red for the lowest (most negative) values, where the polypepide is most flexible, to blue for the highest (most positive) values in the most structured and rigid regions of the protein. (Courtesy of the University of California, San Francisco and reproduced with permission from ref. 6.)

