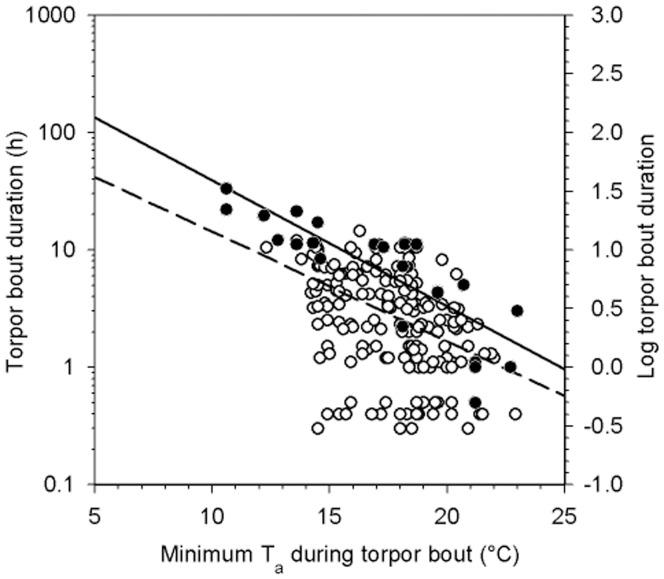
Figure 2. Duration of torpor bouts (log10) as a function of the minimum Ta of each torpor bout.
All torpor bouts recorded are represented by the open circles and dashed line (log10 TBD = 2.1–0.09[Ta °C]; R2 = 0.2, P<0.001, F1,209 = 55.0). The two longest bouts recorded for each individual are represented by the closed circles and solid line (log10 TBD = 2.7 - 0.1[Ta °C]; R2 = 0.8, P<0.001, F1,25 = 73.3).

