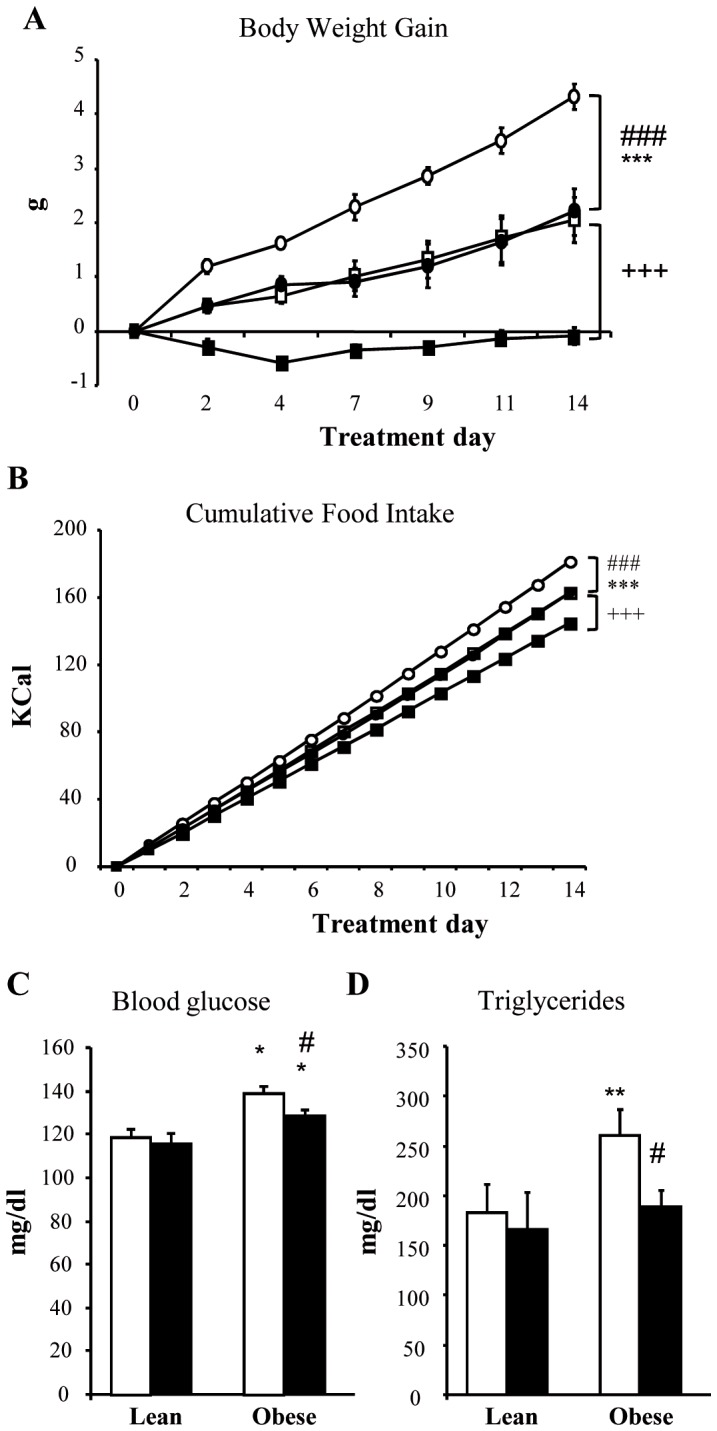
Figure 1. In vivo sodium tungstate effects.

Mice were treated with 2 g/l of sodium tungstate in water for 14 days. Body weight gain (A) and food intake (B) were measured for the duration of treatment, and blood glucose (C) and TG (D) were measured at the beginning and at the end of treatment. Open squares correspond to untreated lean mice (UL) (n = 6), black squares to treated lean mice (TL) (n = 6), open circles to untreated obese mice (UO) (n = 6), and black circles to treated obese mice (TO) (n = 6). In the bar graph, white and black bars represent untreated and treated animals, respectively. *p<0.05; **p<0.01; ***p<0.001 vs. lean mice. +++ p<0.001 treated lean vs. untreated lean mice. # p<0.05; ###p<0.001 treated obese vs. untreated obese mice. Data are the mean±SD.
