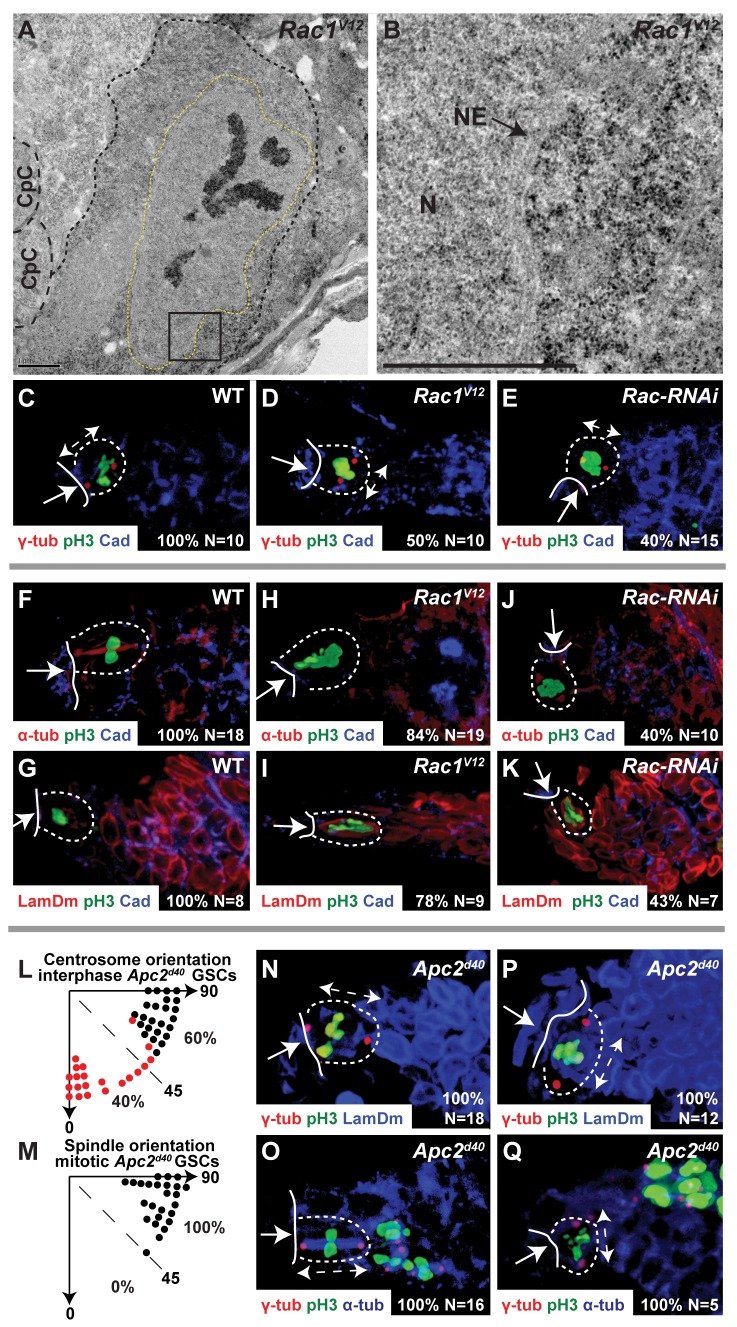
Figure 3. Centrosome misorientation causes GSC cell cycle arrest.
(A,B) Transmission electron micrograph of a Rac1V12 GSC with condensed chromosomes, intact nuclear envelope, and no mitotic spindle. (A) Small-dashed line, GSC cell membrane; large-dashed line, CpC cell membrane; dashed yellow line, GSC nuclear envelope. (B) Boxed region of (A); N, GSC nucleus; NE, GSC nuclear envelope. Scale bars, 1 µm. (C–E) Centrosome orientation in anti-pH3 stained GSCs, wild-type (C), Rac1V12 (D), and Rac-RNAi (E). (F–K) Spindle formation (F,H,J) and nuclear envelope breakdown (G,I,K) in anti-pH3 stained GSCs, wild-type (F,G), Rac1V12 (H,I), and Rac-RNAi (J,K). (L,M) Angle, in individual Apc2d40 GSCs, between the CpC-GSC interface and the line connecting two cortical centrosomes separated by 180° (L) or mitotic spindle poles (M). Black dot, one centrosome (L) or spindle pole (M) at the CpC-GSC interface. Red dot, neither centrosome (L) or spindle pole (M) at the CpC-GSC interface. Percentage (%) of GSCs with each phenotype compared to total in the graph. (N–Q) Absolute correlation between centrosome orientation and M-phase progression in Apc2d40 GSCs. (C–K, N–Q) Arrow, CpC niche; solid line, CpC-GSC interface; dashed outline, individual GSC. (C–E,N–Q) Anti-γ-tubulin, centrosomes; double headed arrow, centrosome orientation; (F,H,J,O,Q) anti-α tubulin, mitotic spindle; (G,I,K,N,P) anti-Lamin-Dm, nuclear envelope; (C–K,N–Q) anti-pH3, mitotic chromosomes. (C–K, N–Q) Percentage (%) of total (N) GSCs with the specific phenotype displayed in the panel.

