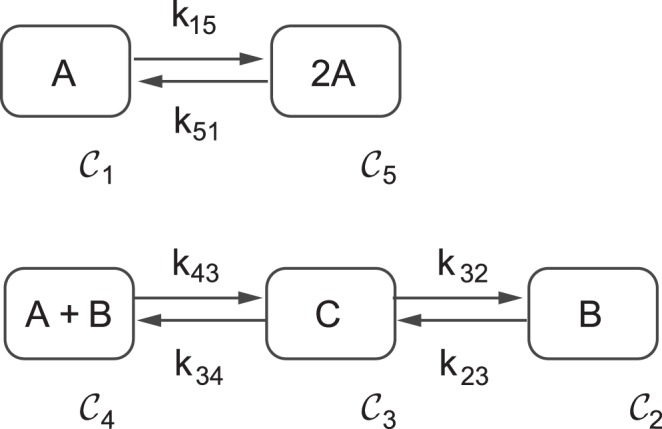
Figure 2. Graph of complexes (C-Graph) for the Edelstein network.

The network involves three chemical species A, B and C. Nodes in the graph correspond with complexes, denoted by  with
with  . Arrows in the graph represent reaction steps. In this example every reaction is reversible.
