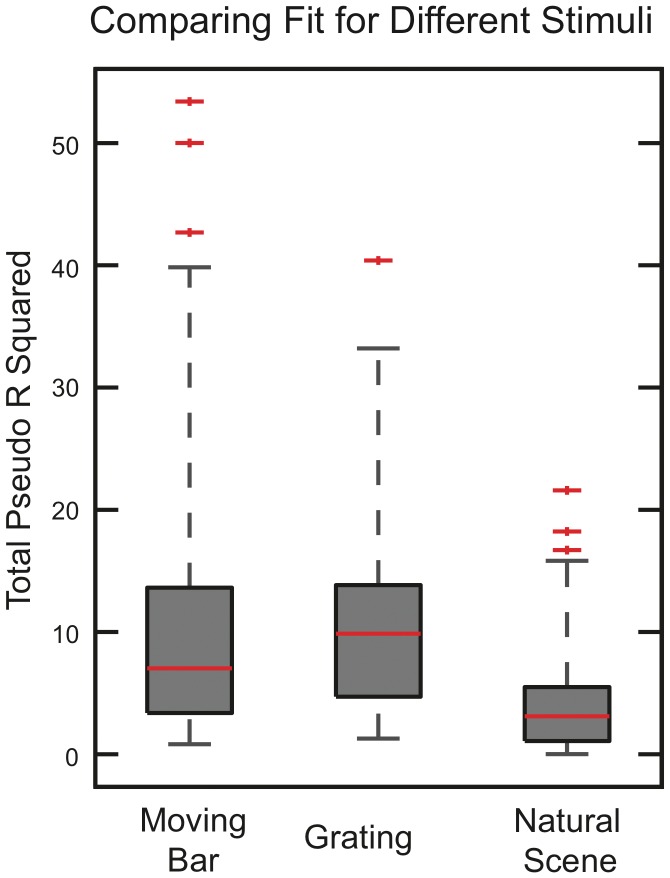
Figure 5. Pseudo R squared of neurons responsive to natural scenes, grating and moving bar stimuli.
Box plots of total pseudo R squared accounted for by the full stimulus only (CRF + surround) for natural scenes, gratings and moving bars. The simpler “laboratory type” stimuli are better fit (median 10% gratings, 7% bars) than the natural scenes (median 3%) suggesting that the they may impose a more coherent dynamics on V1 than natural stimuli do.

