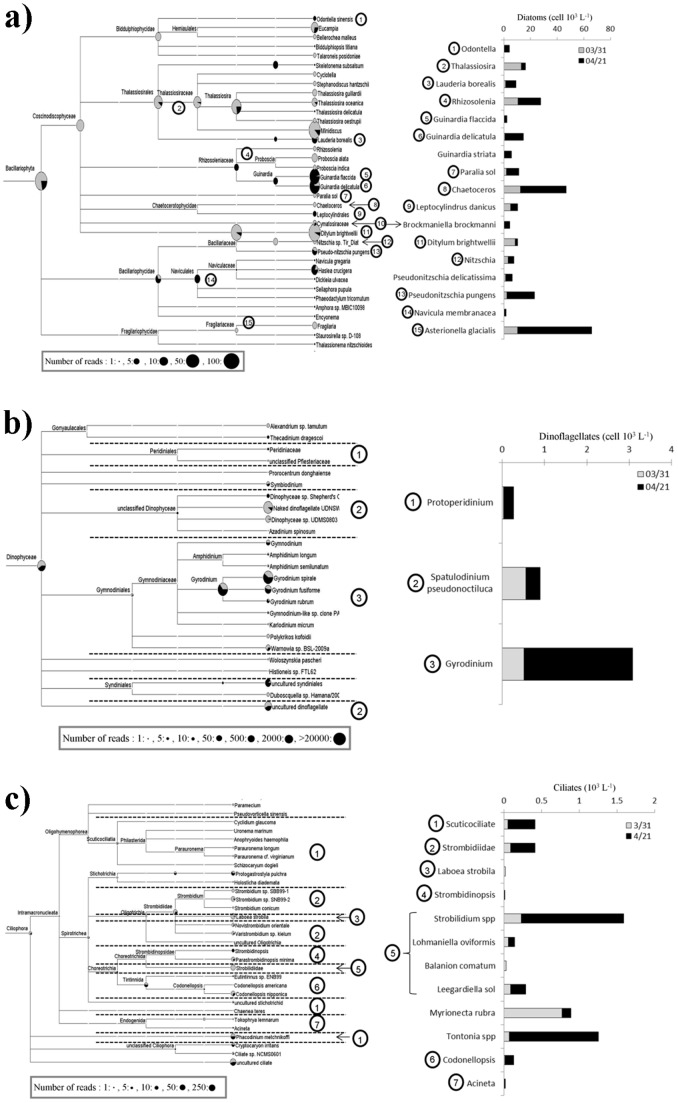
Figure 4. Composition of plankton communities before and during the spring bloom of Phaeocystis.
Planktonic community composition of the groups (a) Bacillariophyta (diatom), (b) Dinophyceae (dinoflagellates) and (c) Ciliophora (ciliates) was inferred from tag pyrosequencing (left side) and morphological observations (right side). Assignment of 18S rRNA hypervariable tag pyrosequences displayed from the MEGAN software [35], after BlastN [34] search against the Silva SSU rRNA database. The MEGAN software plots on a schematic phylogenetic tree, the number of reads assigned to a particular group. Each taxonomic node is represented by a pie diagram, with March 31st sample in grey and April 21st sample in black color, whose size is proportional to the number of assigned reads (scale indicated on the bottom-left side of the figure). On the right side of the figure, the abundance of the plankton (genera – species) groups identified from morphological observations is displayed with histograms using the same color-coding as for the MEGAN tree (on the left). The circled numbers indicate the correspondences between groups identified using the two approaches (tag pyrosequencing and morphological observations).

