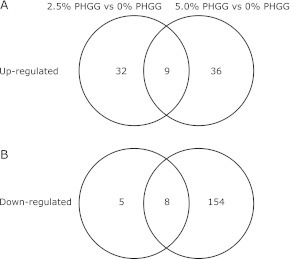
Fig. 1.
Number of transcripts putatively associated with chronic treatment of PHGG. A Venn diagram showing the number of transcripts differing significantly between differing composition of PHGG (A) Transcripts of genes significantly up-regulated between 0% PHGG diet group and 2.5% PHGG diet group, and between 0% PHGG diet group and 5.0% PHGG diet group. Combination of these two comparisons by Venn diagram illustrates the number of genes up-regulated by chronic treatment of PHGG. (B) Transcripts of genes significantly down-regulated between 0% PHGG diet group and 2.5% PHGG diet group, and between 0% PHGG diet group and 5.0% PHGG diet group. Combination of these two comparisons by Venn diagram illustrates the number of genes down-regulated by chronic treatment of PHGG. Genes that satisfied the criteria of fold change ≥1.5 and p value ≥0.05 were considered significantly regulated.

