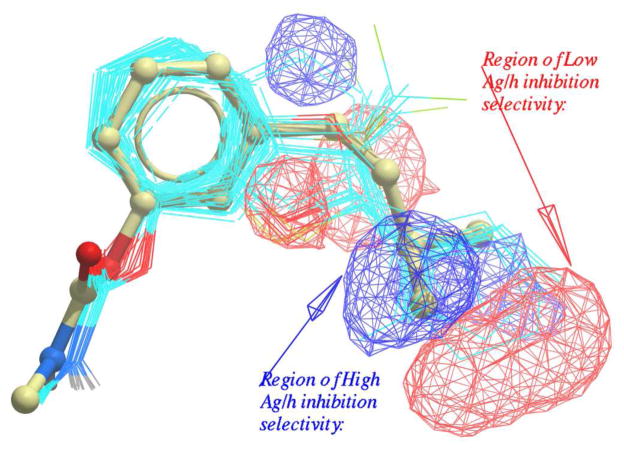
Figure 4.
3D QSAR lipophilic field visualizations for the Ag/h inhibition selectivity of the compounds in Tables 1–3. Lipophilic occupancy of blue regions improves Ag/h inhibition selectivity, and lipophilic occupancy of red regions decreases selectivity. 20w is shown in stick; other compounds are shown in CPK-colored wire (carbon is cyan).

