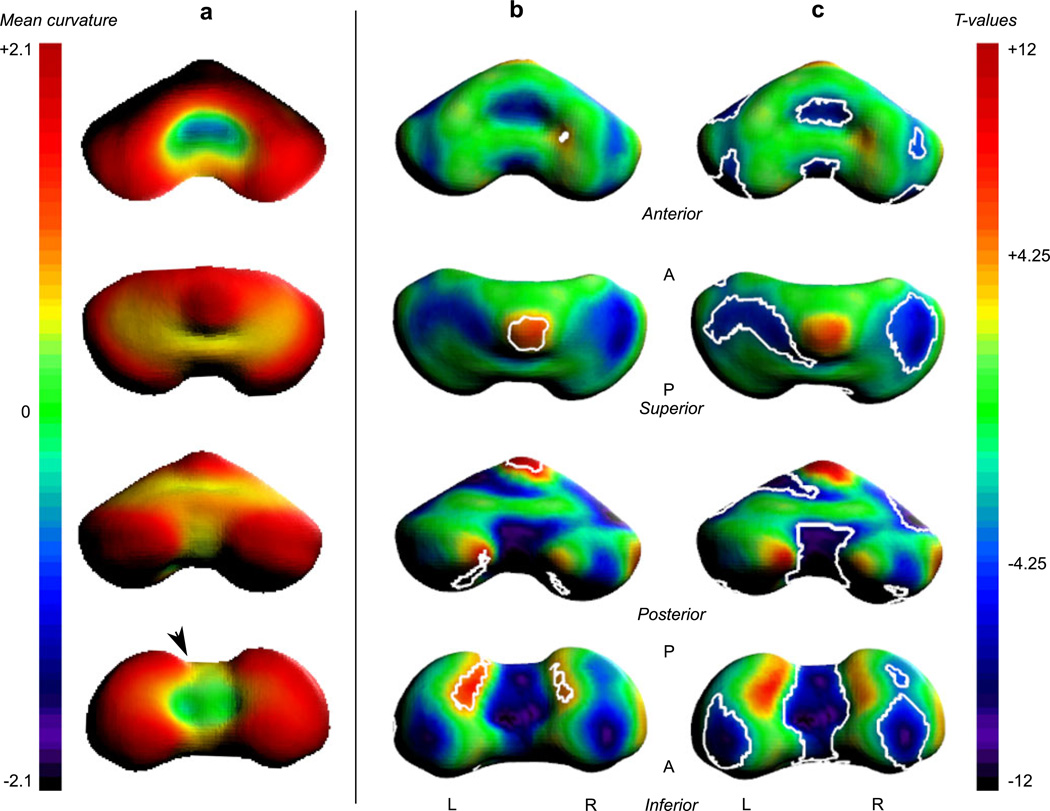
Fig. 6.
Local curvature analysis of the cerebellar surface. a The mean curvature across all ages is overlaid on the average surface. Positive values (warm colors) express local convexity, and negative values (cool colors) indicate local concavity. Age-related changes in local curvature were tested for significance with multiple comparisons correction at p < 0.05 (|T| > 4.25). The last two columns show the full T maps with contours around the significant increases (b) and decreases (c) in convexity. Changes in curvature surrounding the inferior vermis are related to the formation of the paravermian fissure (arrow head)

