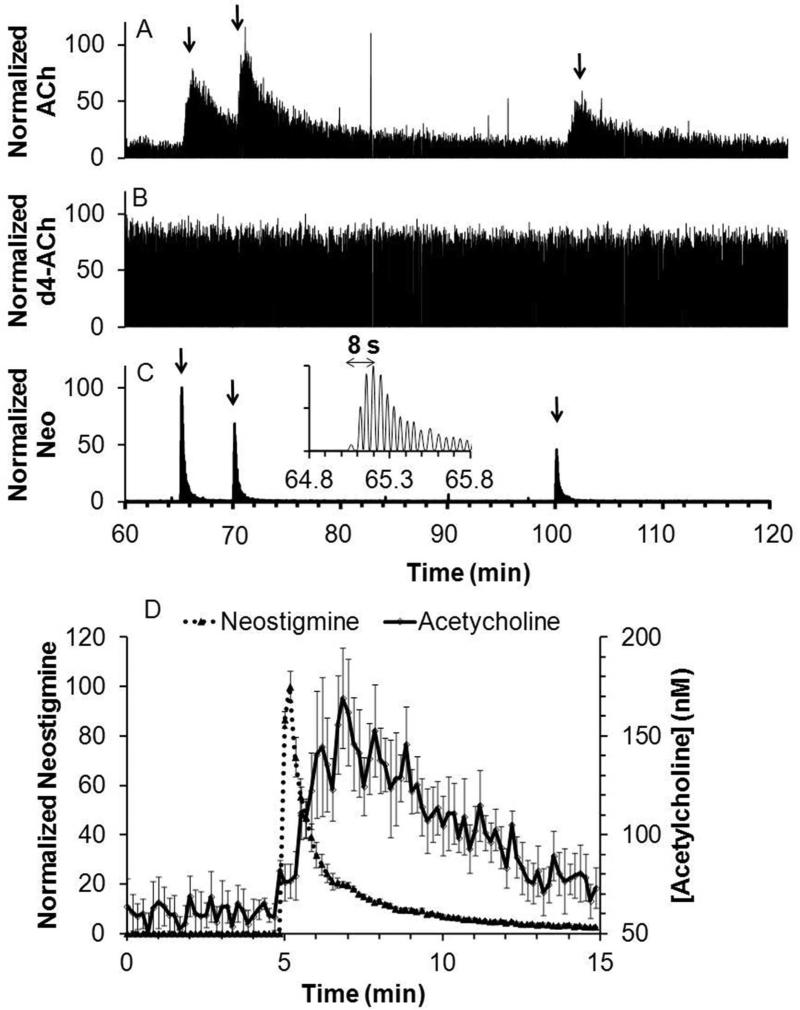
Figure 5.
Recording of response to in vivo microinjection of neostigmine. Figure showed a sample trace for simultaneous detection of (A) acetylcholine (ACh); (B) internal standard, d4-acetylcholine (d4-ACh); and (C) neostigmine (Neo). Arrow indicates beginning of each microinjection. Insert is a magnified view of the 1st microinjection for neostigmine detection. (D) Averaged acetylcholine response to neostigmine microinjection (dotted line) overlaid with averaged neostigmine signal (solid line), (n = 6, error bar = SEM). Response of 2 to 3 droplets were binned in to one data point at 10 s interval for the averaged plot.

