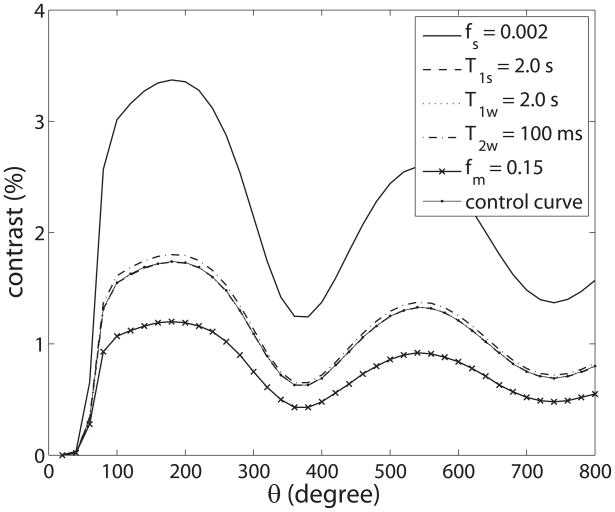
FIG. 2.
Plot of simulated CEST contrast as a function of θ for different fs, T1s, T1w, T2w, and fm. Unless otherwise specified, the parameters driving the simulation are 0.001, 1.5 s, 1.5 s, 60 ms, and 0.1 (which are also the parameters for the control curve), respectively. This figure illustrates how the contrast dependence on θ scales with the sample parameters. The control curve nearly coincides with the curves varying T1s and T1w, since variations in these parameters have little effect on the measured water signal contrast.

