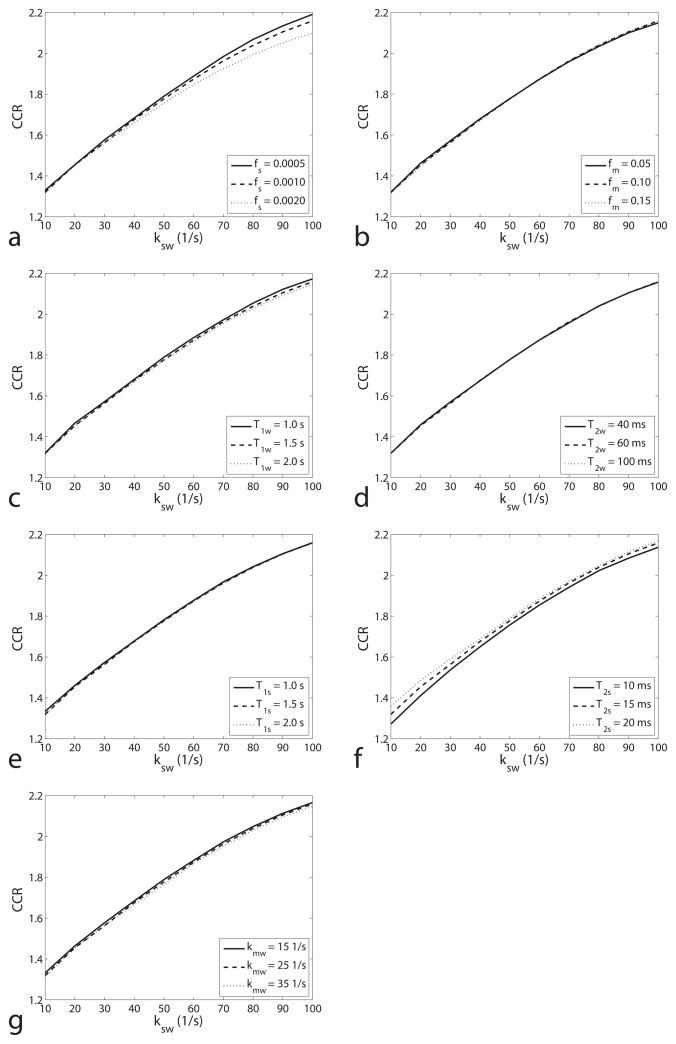
FIG. 4.
Simulated CEST ratio vs. ksw for different fs (a), fm (b), T1w (c), T2w (d), T1s (e) T2s (f) and kmw (g). Note that the CEST ratio is a monotonic function of ksw (10 – 100 1/s), and is roughly independent on all the other parameters in our simulation range. Although the CEST ratio changes with fs (a roughly 1% change as fs varies from 0.001 to 0.002 at ksw of 50 1/s), it is negligible compared with the changes in traditional CEST contrast (100% for the same fs variation). Simulations were performed by using a three-pool model with a symmetric MT effect.

