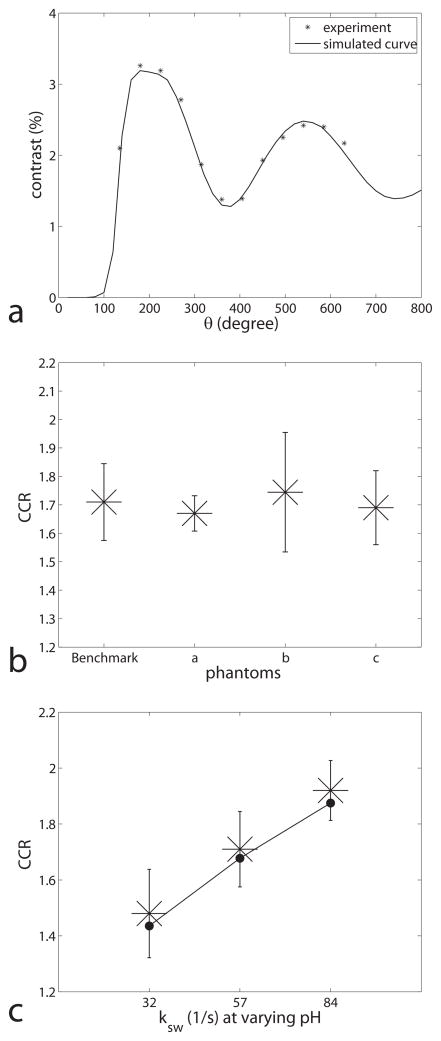
FIG. 5.
(a) Experimental (star) and simulated (solid line) CEST contrasts for a creatine/agar sample vs. θ. The simulation parameters were from the fitting results from a CW-CEST experiment on the same sample. (b) Experimental CEST contrast ratios for creatine/agar samples with benchmark, a, b, and c on the x-axis representing three samples with approximately the same ksw (57± 5, 55 ± 4, 59 ± 6, and 56 ± 4 1/s, respectively), but high fs = 0.0019 ± 0.0002 for sample ‘a’(vs. 0.0009 for ‘benchmark’, ‘b’ and ‘c’), short T1w = 1.42 ± 0.06 s for sample ‘b’(vs. 2.80 s for ‘benchmark’, ‘a’ and ‘c’), and low fm = 0.005 ± 0.001 for sample ‘c’ (vs. 0.016 for ‘benchmark’, ‘a’ and ‘b’). (c) Experimental CEST contrast ratio vs. the titrated pH. The fitted ksw are 32 1/s, 57 1/s, and 84 1/s for pH of 5.6, 6.0, and 6.4, respectively. Note that the ratio changes with ksw in figure 5c, but not other parameters in figure 5b. Also note that the experimental results (star) are close to our simulation results (dot) with fitted parameters.

