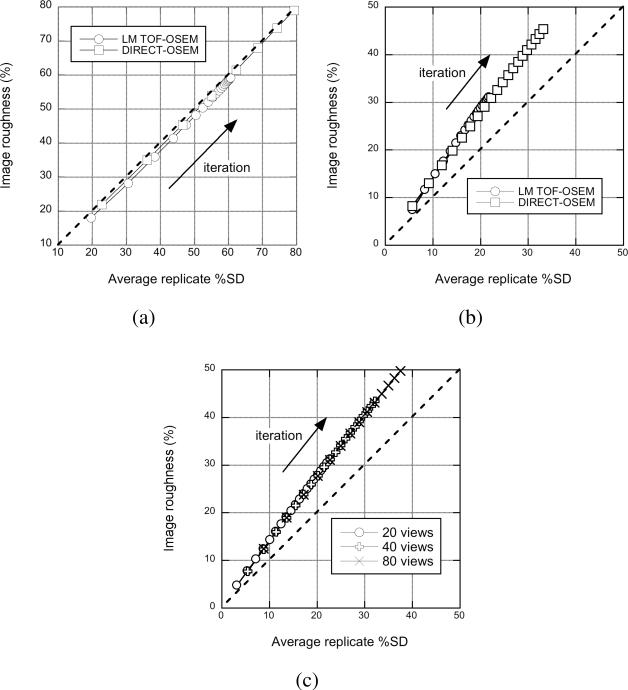
Fig. 3.
Comparison of image roughness and statistical noise measured using replicate scans in the sphere phantom. Image roughness is plotted as a function of %SDrep for (a) low and (b) high count densities for list-mode TOF-OSEM and DIRECT-OSEM approaches. (c) Image roughness is plotted as a function of %SDrep for DIRECT using different numbers of views for the high-count case.

