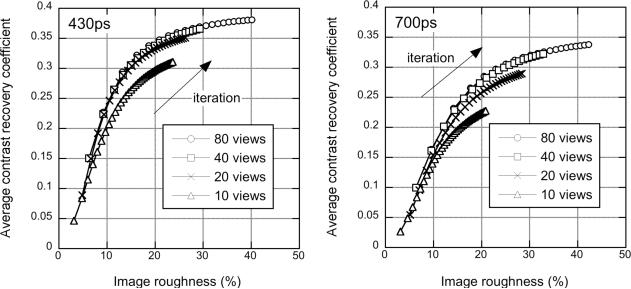
Fig. 6.
Sphere phantom: Views - CRC vs. image roughness performance for the sphere phantom study with 76 M true events as a function of number of transverse angular views used in DIRECT. The average CRC for the 20 spheres is plotted for the data with 430-ps timing resolution (left) and 700-ps (degraded) timing resolution (right) as a function of image roughness for 80 views: ∘, 40 views: □, 20 views: ×, and 10 views: △. The curves were generated for increasing numbers of iterations.

