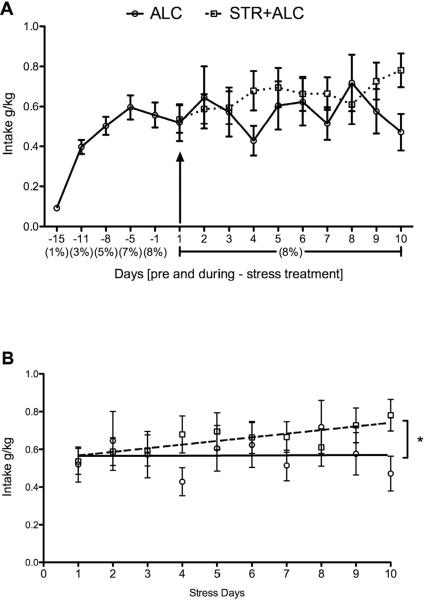
Figure 2.
(A) Mean alcohol consumption pre- and during-stress treatment. Negative numbers designate days before stress and positive numbers designate days of stress. Numbers in parenthesis show concentration of alcohol (v/v) presented. Arrow denotes first day of stress. (B) Mean alcohol consumption over days of restraint stress. Dashed regression line plotted for STR+ALC group and solid regression line plotted for ALC group. Asterisk (*) indicates a significant difference (R2=0.245, p=0.026) between group regression lines.

