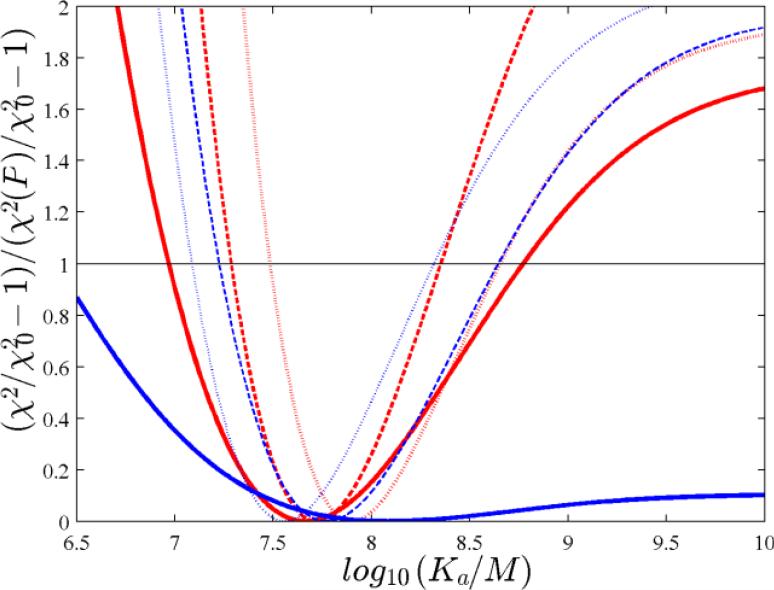
Figure 5.
Analyses of ITC experiments conducted in a dilution series. Error projection map from the analysis of (I) triplicate experiments titrating 200 μM CAII into 20 μM TFMSA with 40 injections of 1 μl each generating initial heats of ~-8.2 μJ (dotted lines); (II) quadruplicate experiments titrating 100 μM CAII into 10 μM TFMSA with 40 injections of 1 μl each generating initial heats of ~-4.2 μJ (short dashed lines); (III) triplicate experiments titrating 50 μM CAII into 5 μM TFMSA with 40 injections of 1 μl each generating initial heats of ~ -2.1 μJ (solid lines). The error projection maps shows the value of the global χ2 as a function of parameter values for Kd, scaled such as to have a minimum at ordinate values of 0 corresponding to the best-fit χ2 and values of 1 at a χ2 corresponding to a 95% confidence level (black horizontal line).Global analyses are shown from NITPIC processing of thermograms (red) and ORIGIN processing (blue). In set I, one outlier data point was excluded in the ORIGIN analysis, and in set III one outlier data point was excluded in both NITPIC and ORIGIN analyses.

