
Figure 2.
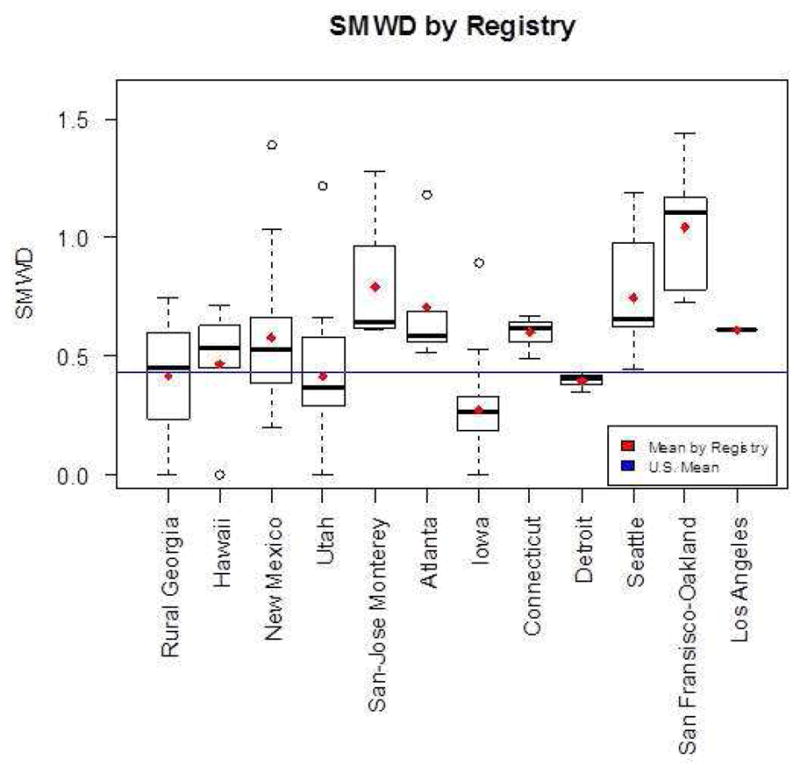
Sexual Minority Women Density by Registry. Plotted means in red and blue are calculated over the counties included in the individual registries or over the entire U.S. respectively. (The bottom and top of the box are the 25th and 75th percentile and the band near the middle of the box is the median. The ends of the whiskers represent the lowest datum still within 1.5 interquartile range (IQR) of the lower quartile, and the highest datum still within 1.5 IQR of the upper quartile. The dotted line represents the range from the lower(higher) quartile to the lowest(highest) datum that is within 1.5 IQR. IQR is the difference between the 75th and the 25th percentile.)