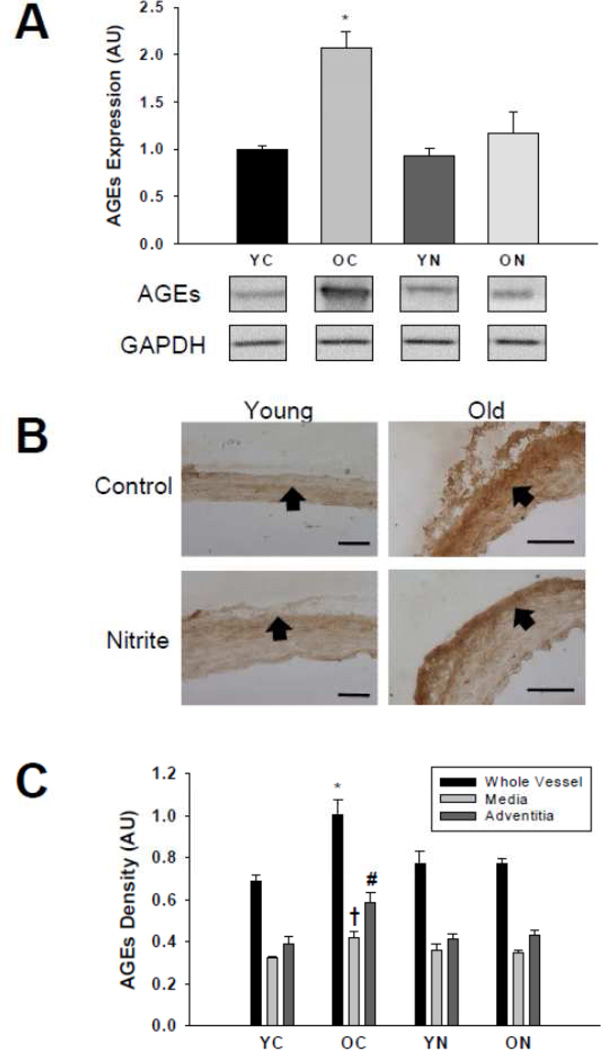
Figure 6. AGEs protein expression.
Thoracic aorta expression of AGEs assessed by (A) western blot of whole artery lysates and (B) histological cross-sections with (C) quantification from young and old control (YC and OC) and nitrite supplemented (YN and ON) mice (n = 4–8 per group). Values are mean ± S.E.M. * p<0.05 vs. whole vessel YC, YN and ON; † p<0.05 vs. media YC, YN and ON; # p<0.05 vs. adventitia YC, YN and ON. Arrows demarcate the medial-adventitial border; Bar = 100 µm.

