
Fig. 3. Growth factor stimulation induces Rhes-mediated AKT activation and subcellular localization.
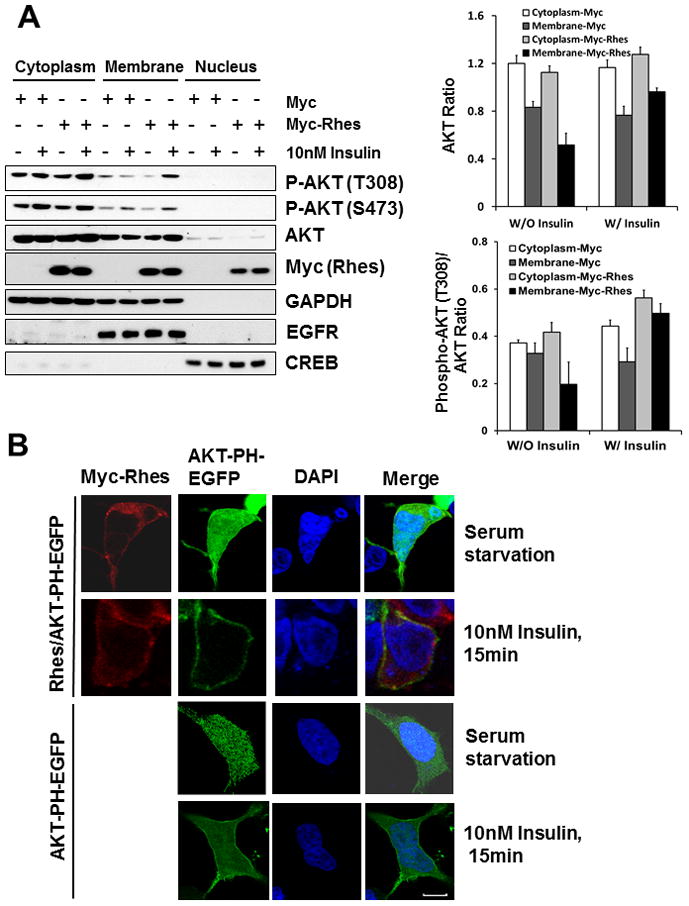
(A) HEK293T cells were transfected with Myc or Myc-Rhes for 24 h. Cells were serum-starved for 20 h, and treated with 10nM Insulin for 15 min. Each fraction was isolated for western blot analysis as described in Material and Methods. (Top) Relative AKT levels in cytoplasmic and membrane fractions normalized by GAPDH and EGFR, respectively. (Bottom) Relative P-AKT levels are normalized by total AKT. Bars represent mean ± SD, n=3.
(B) Stable cell line of HEK293 expressing AKT-PH domain-EGFP were transfected with Myc or Myc-Rhes. 24 h later, cells were serum-starved for 20h, and stimulated with 10nM Insulin for 15 min. Cells were fixed, and stained with anti-myc and DAPI for confocal microscopy, as described in Materials and Methods. Merge represents an overlay of Rhes in red and AKT-PH in green. The blue indicates the nuclei stained with DAPI. Scale bar, 5 μm.