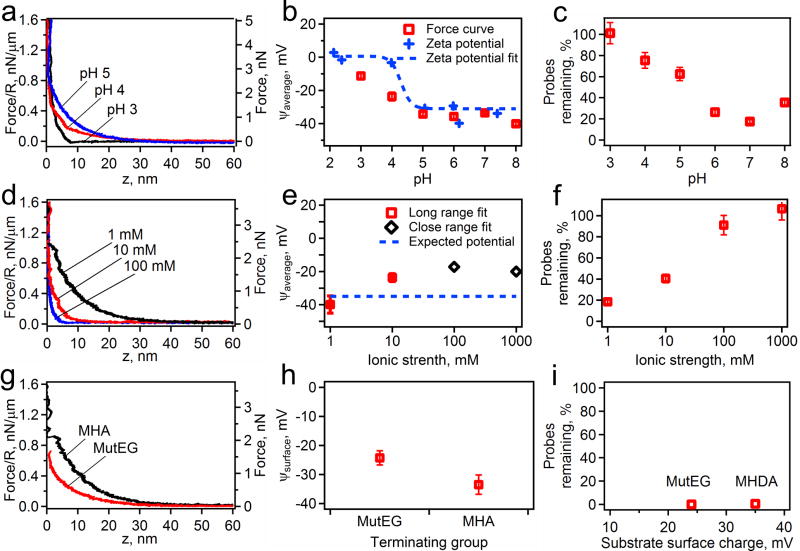
Figure 3.
The effects of changing the pH with a constant ionic strength of 1 mM on an MHA surface, (a, b, c), the solutions ionic strength with a constant pH of 7 on an MHA surface, (d, e, f), and the surface chemistry with constant pH of 7 and ionic strength of 1 mM (g, h, i) on the electrostatic forces. The measured force profiles are shown as an AFM cantilever lowers a probe towards a surface under various conditions (a, d, g). The pH (a), ionic strength (d), and the surface chemistry (g) are labeled on each plot. From these force profiles, electrostatic properties, such as Debye length and the surface potential of the probe and substrate, are measured by fitting to DLVO theory (b, e, h). In b, the data is plotted with the measured zeta potential of the probes only (blue crosses) and shown with the fit of the zeta potential (blue dotted line) to expected pH titration curve. Finally the fraction of remaining probes on the surface after a magnet is applied is shown for all the conditions measured (c, f, i).

