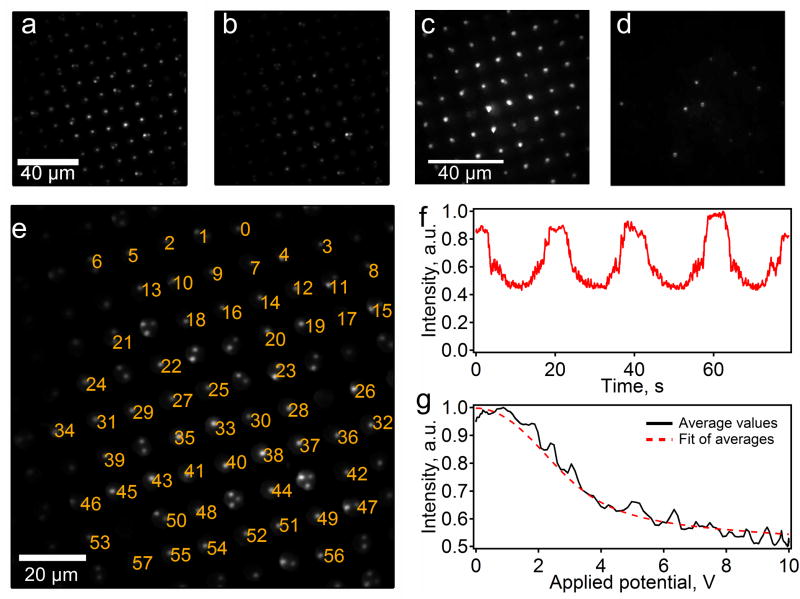
Figure 5.
Force spectroscopy of ssDNA conducted using DEP tweezers on a system optimized using design principles based on results from this paper. Force probes tethered to DNA in wells before (a) and after (b) they were exposed to a DEP force. Free force probes settled in wells before (c) and after (d) the DEP force was applied. The brightness of the probes (a–d) varies due to Gaussian profile of the illumination laser beam and variations in the bead sizes. (e) A single frame from a movie of the probes, showing the indexing of the force probes for data analysis. (f) A representative intensity vs. voltage plot for one probe. (g) Fits of the data from the plot in part f.

