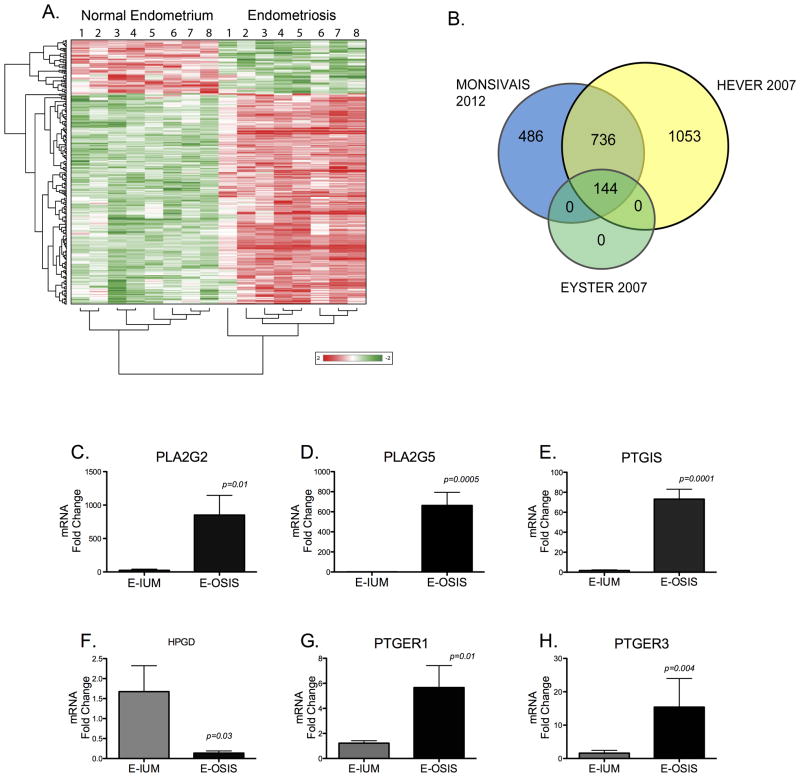
Figure 1.
A, Hierarchical Clustering Demonstrates a Unique Gene Expression Profile for Ovarian Endometriosis when Compared to Matched Eutopic Tissues. Fold change values ≥ 2-fold for significantly regulated genes were subjected to hierarchical clustering. Red represents the upregulation of a gene, while green denotes a decrease relative to the mean intensity value for each probe. Each row represents a single probe set and the columns represent the individual tissue samples. B, Numbers in the overlapping regions indicate similarly regulated genes according to three microarray studies of ovarian endometriosis, the current study, Hever et al (2007), and Eyster et al (2007). The selected genes used to construct the Venn diagram from each study had a ≥ 2-fold change and P < 0.05 for endometriosis compared to the eutopic endometrium. C–H, Genes in the Prostaglandin Pathway are Altered in Endometriosis (E-OSIS) Compared to the Eutopic Endometrium (E-IUM). RNA was isolated from 6 matched endometriotic and eutopic tissues and subjected to Real Time-PCR as described in Materials and Methods. C–D, Phospholipase Enzymes; C, PLA2G2; D, PLA2G5; E, Prostacyclin synthase (PTGIS); F, 15-hydroxyprostaglandin dehydrogenase (HPGD); G–H, prostaglandin E2 receptors; G, PTGER1; H, PTGER3. The dataare represented as Fold Change ± SEM.

