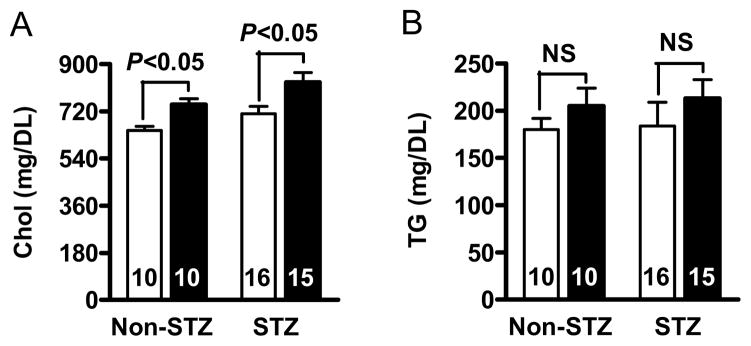
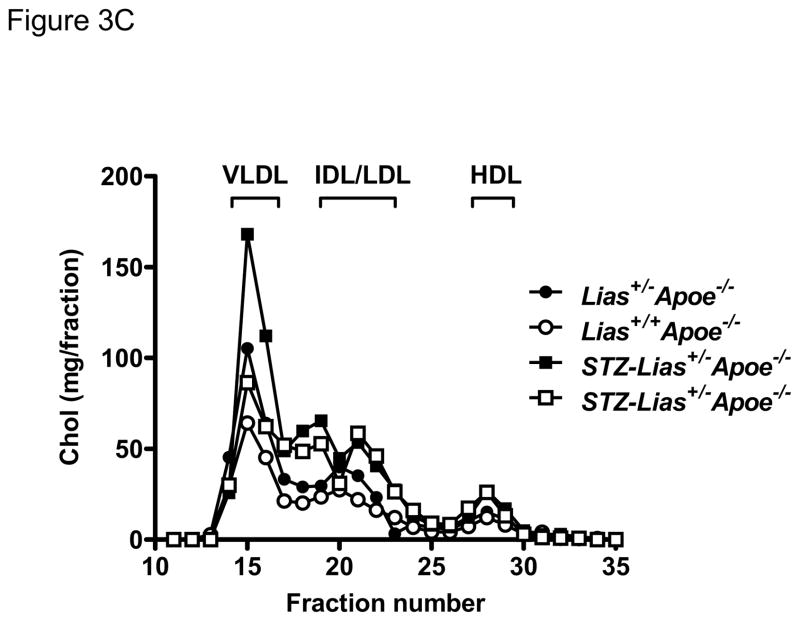
Figure 3.
Plasma cholesterol (A) and triglyceride levels (B) in diabetic Lias+/+Apoe−/− mice (open bars) and diabetic Lias+/−Apoe−/− mice (black bars). Results are expressed as means ± SEM. (C) FPLC of plasma from diabetic and non-diabetic Lias+/−Apoe−/− and Lias+/+Apoe−/− mice. Equal volumes of plasma from the mice at 6 months old were pooled and subjected to gel filtration chromatography. Eluted fractions (0.5 ml) were collected, and cholesterol concentrations were measured as described in methods. VLDL, very-low-density lipoproteins; IDL, intermediate density lipoprotein; LDL, low-density lipoproteins; HDL, high-density lipoproteins.


