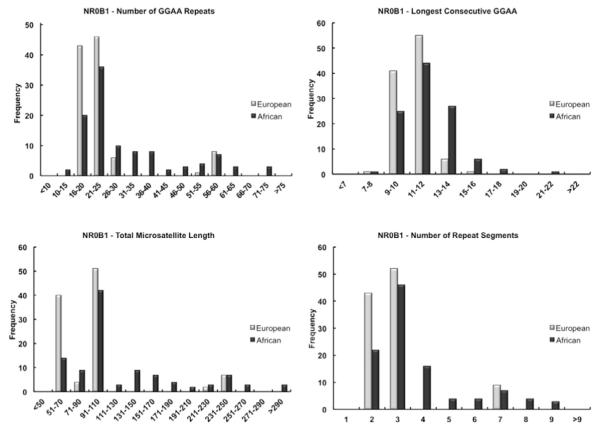
Figure 3.
Histogram plots demonstrating the distribution of the NR0B1 GGAA microsatellite characteristics in European and African populations. Panel A illustrates the total number of repeats, showing a predominant clustering of the European data around shorter sequences consisting of 16-25 repeats, whereas the African data is much more disperse with a greater distribution towards larger repeat numbers. Similar trends are depicted for the total microsatellite length (Panel C) and the number of repeat segments (Panel D).

