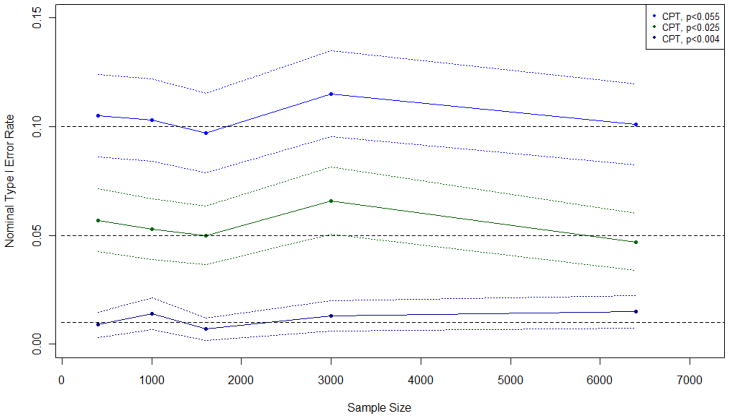
Figure 3.
Observed type I error rates and 95% confidence intervals of conditional permutation test (CPT) when applied with an adjusted cutoff to a circular study region with a probability of disease of 0.10
Figure 2 displays the observed type I error rate and 95% confidence intervals of the conditional permutation test when applied with an adjusted cutoff to data from the circular study region with a probability of disease of 0.10 and sample sizes ranging from 400 to 6,400. Similar plots were observed for other probabilities of disease and region shapes and are available upon request.

