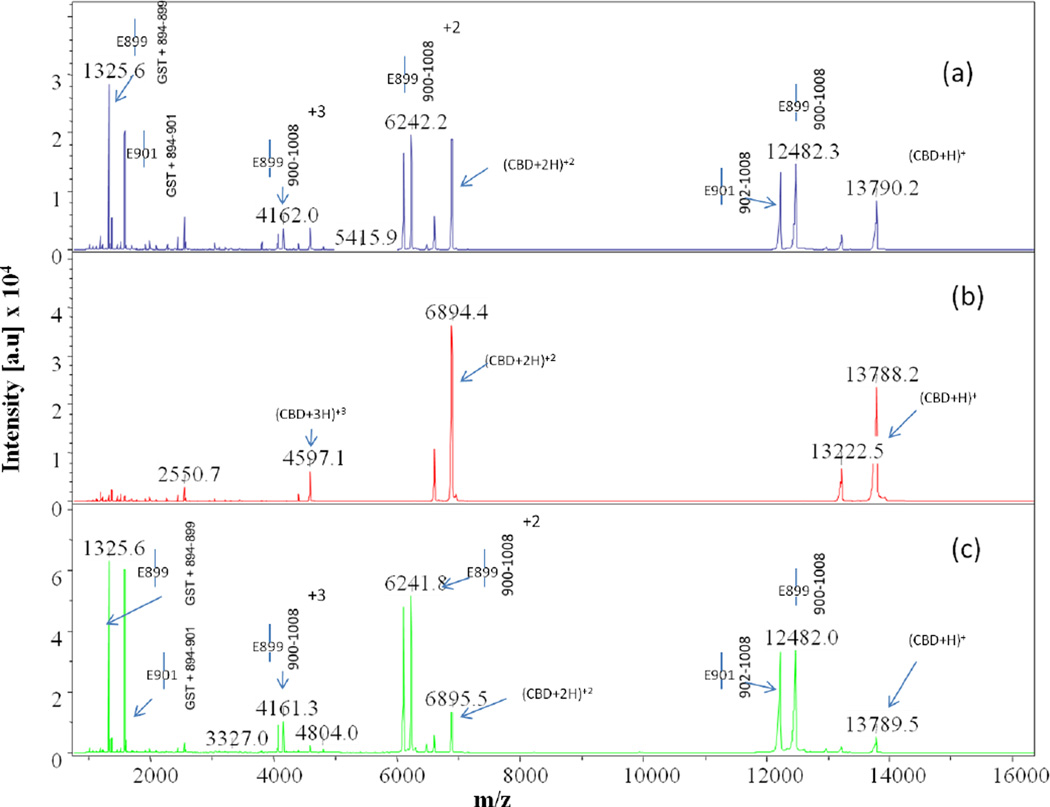
Fig. 4.
Comparison of MALDI-TOF MS spectra collected at time point t = 3hr for Glu-C digests of (a) apo-, (b) calcium-bound, and (c) cobalt-bound CBD. Spectrum (b) reveals intense m/z peaks at 13788, 6894, and 4597 representing the intact parent peak and the corresponding doubly and triply charged peaks, respectively, clearly showing that no digestion of the protein occurs when calcium is bound. The peaks next to these labeled intact peaks represent the protein minus the GST tag

