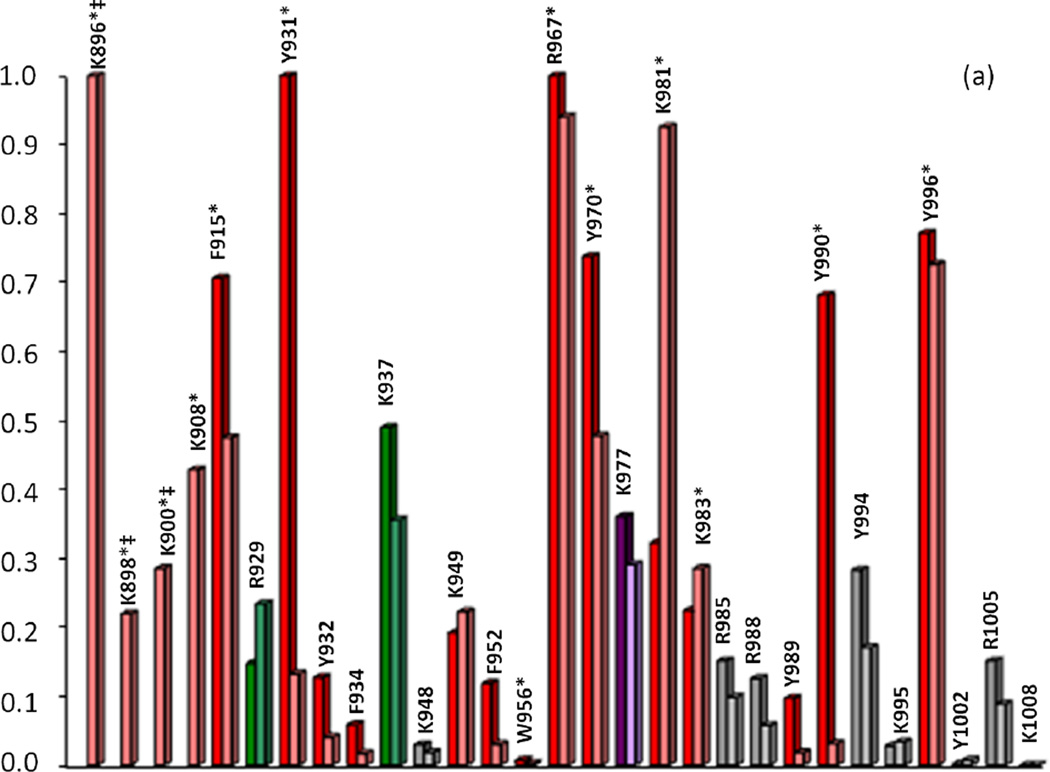
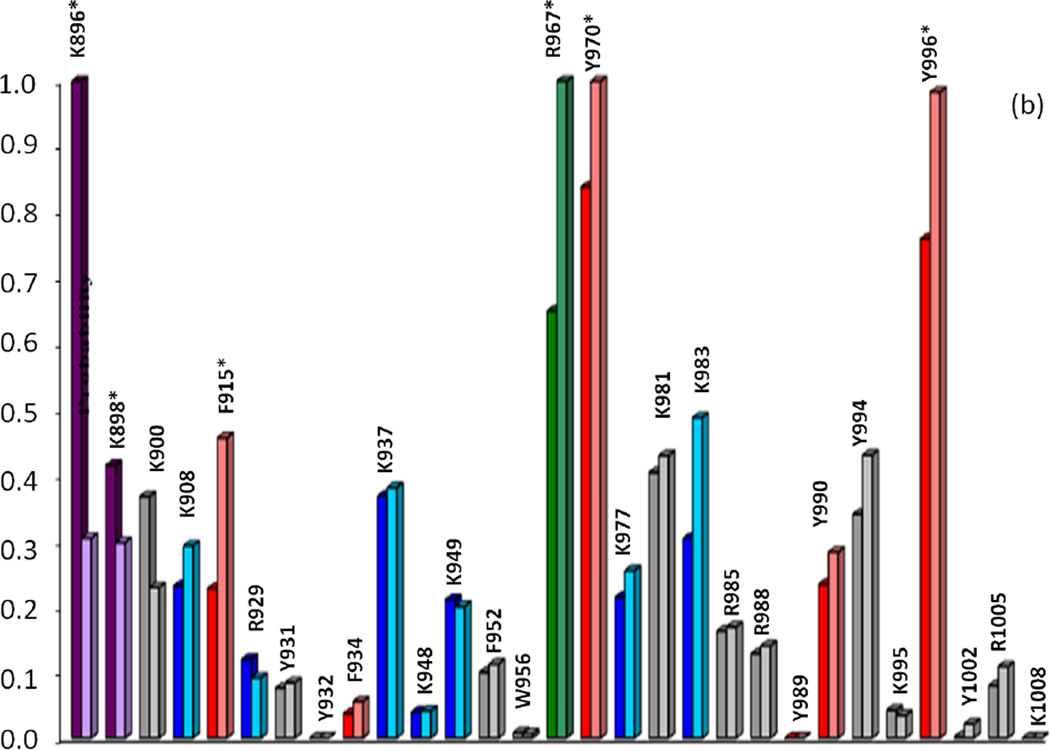
Fig. 6.
Correlation of calculated primary cleavage probability of CBD residues in Molecules A (left) and B (right) with MS trypsin and chymotrypsin (a, apo-; b, calcium-bound) digest results. Colored bars indicate cleavage at t=0 (red), t=10min (green), t=20–30min (purple), t=50min-1hr (blue), or no observed cleavage (gray). Primary cleavage sites determined by MS are indicated by starred (*) residues. ‡Note: Probability values for residues K896, K988, K900 (a, apo-, trypsin) should be significantly higher than all other residues due to high mobility of the N-terminal arm region, yet the values as shown reflect the underestimated crystallographic B-factors used to calculate probability for these residues. See Tables I and II in Supplemental Data for raw data values


