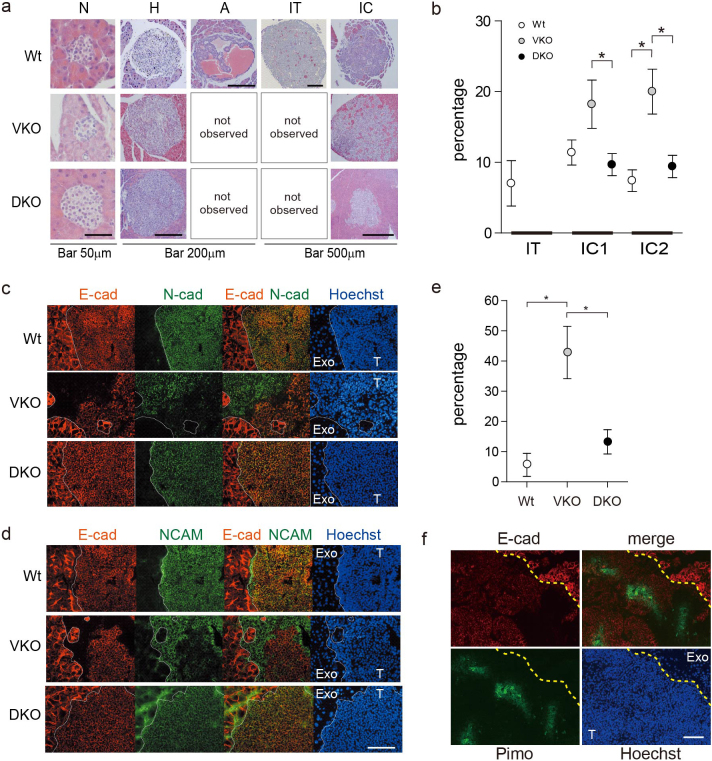
Figure 3. HIF-1α was necessary for invasive phenotype of RIP1-Tag2/VKO tumors.
(a) Microscopic features of the tumors. Representative H&E-stained tumors in each grade are shown. N, normal shaped lesion; H, hyperplasic; A, angiogenic; IT, insulin tumor; IC, invasive carcinoma. (b) Grading of microscopic lesions by the extent of invasion. IT, not invasive; IC1, moderately invasive; IC2, highly invasive. Values are mean and 95-% confidence intervals. *P < 0.05. (c, d) Double staining of E-cadherin and N-cadherin (c) or NCAM (d) in RIP1-Tag2/DKO tumors. Red, E-cadherin (E-cad); green, N-cadherin (N-cad) or NCAM; blue, Hoechst 33342. T, tumor; Exo, exocrine tissue. The boundary of the tumor and the exocrine pancreas is traced with a dotted line. Scale bar, 100 μm. (e) Frequency of tumors with mixed E-cadherin expression among the invasive tumors, shown as the percentage. Values are mean and 95-% confidence intervals. (f) Immunohistochemistry of a RIP1-Tag2/VKO tumor. Red, E-cad; green, pimonidazole; blue, Hoechst33342. Scale bar, 100 μm.

