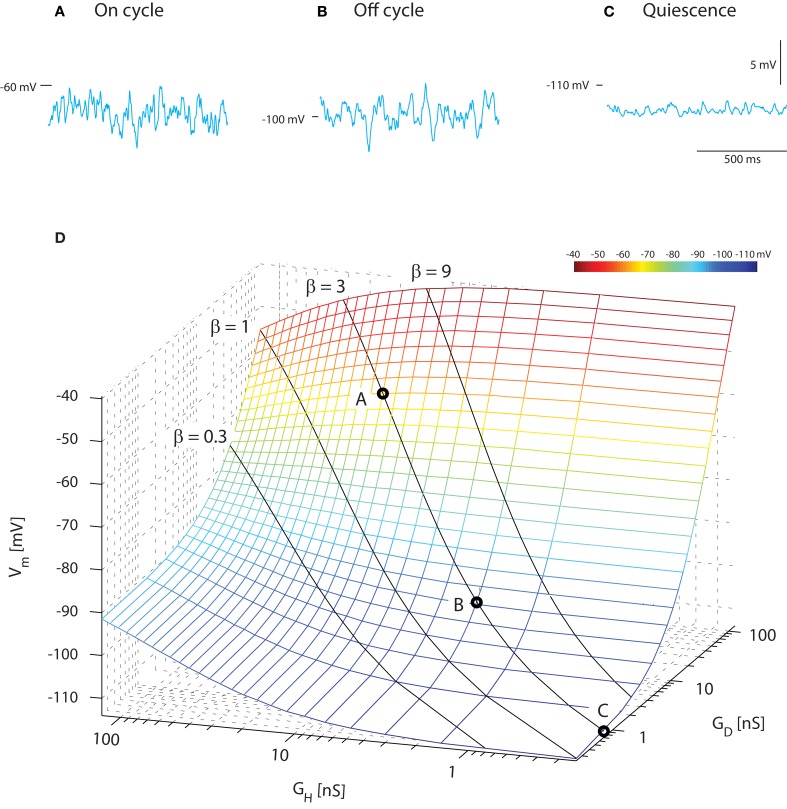
Figure 2.
Mean Vm depolarizes during increase in concurrent inhibition and excitation. Sample traces of membrane potential with synaptic input coming at a poisson stochastic rate (β = 1, i.e., GD = GH and Gint = 0). The total synaptic conductances are 80 nS (A), 12 nS (B), and 1 nS (C) corresponding to the on-cycle, off-cycle, and quiescence states (Figure 1). (D). Average membrane potential as a function of mean depolarizing and hyperpolarizing conductance. The solid lines show where the ratio of these is fixed (β = constant, indicated), but intensity varies along the line. The circled values along the β = 1 line denote the locations of the sample traces in above.

