Figure 3.
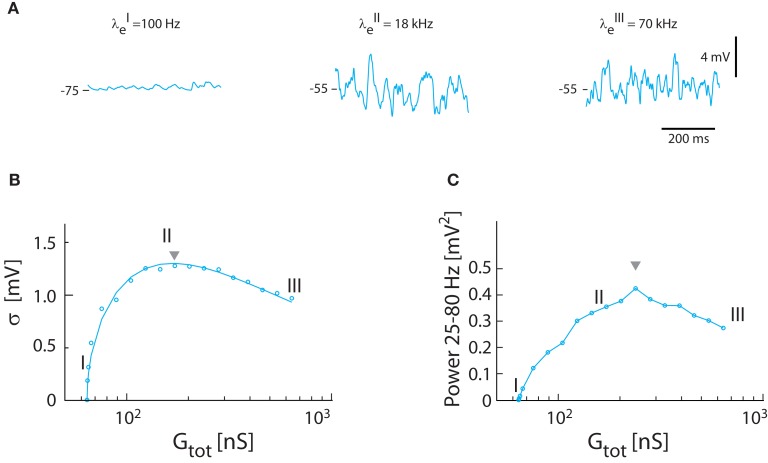
Synaptic fluctuations in the model (γ = 1). (A) The membrane potential for three different intensities of excitatory and inhibitory synaptic input coming at a Poisson stochastic rate. The synaptic conductance is 0.3 nS (I), 108 nS (II), and 576 nS (III). The corresponding input rates are λE = 0.1 kHz, λI = 0 kHz (I), λE = 18 kHz, λI = 3 kHz (II), and λE = 70 kHz, λI = 20 kHz (III). Note that (I) is not balanced because the conductance is not large enough to depolarize Vm to −55 mV, whereas (II) and (II) has reached balanced state, i.e., 〈Vm〉 = −55 mV. (B) Standard deviation of Vm as a function of total conductance, which is proportional to synaptic conductance. The roman numerals I, II, III denote the locations of the sample traces from (A). Solid traces show theoretical values, and circles simulation results. (C) The spectral content in the gamma-band (25–80 Hz) as a function of total conductance.

