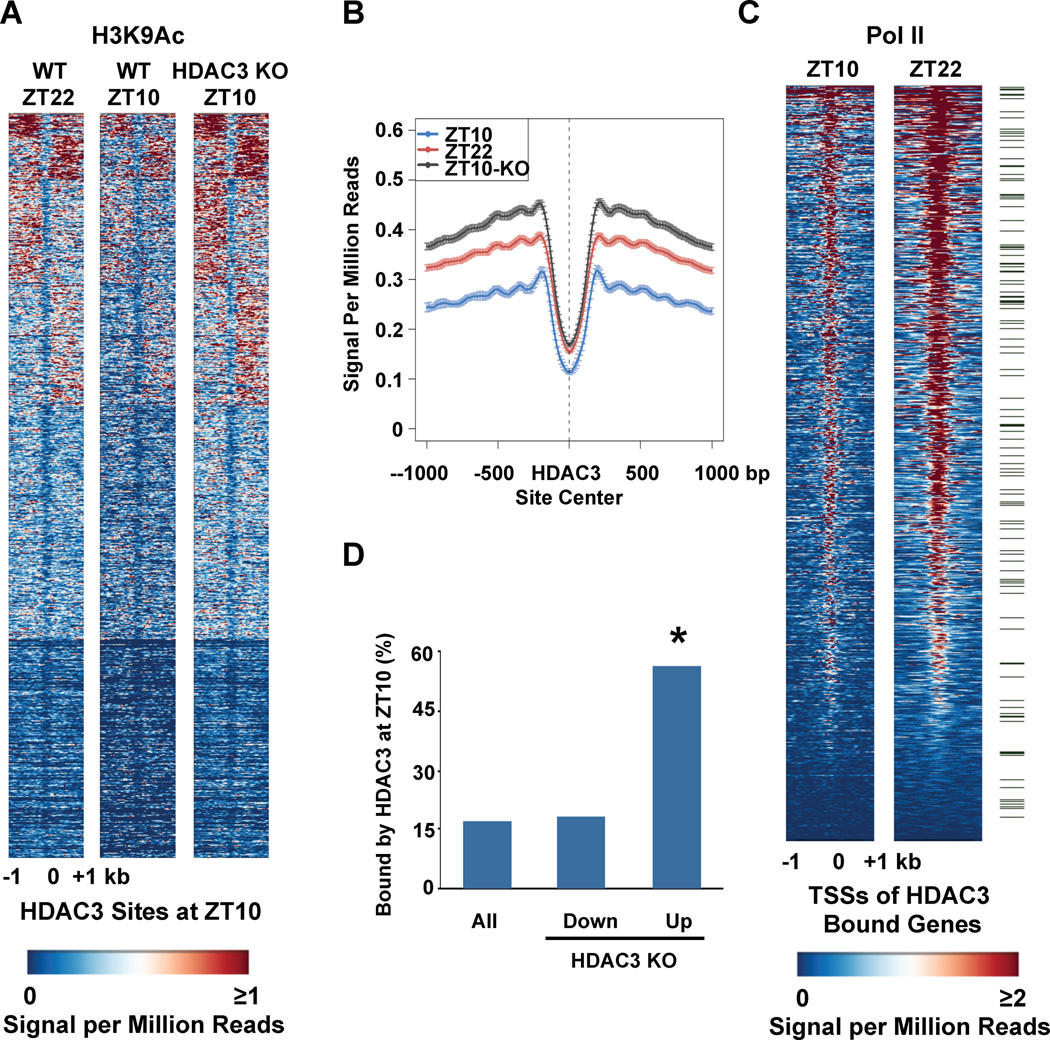
Figure 2. Orchestration of genome-wide rhythms of histone acetylation, Pol II recruitment, and gene expression by HDAC3.
A. Heatmap of the histone H3 lysine 9 acetylation (H3K9Ac) signal in WT liver at ZT22 (left), ZT10 (middle) and ZT10 in liver depleted of HDAC3 (KO) (right) from −1kb to +1kb surrounding the center of all the HDAC3 ZT10 binding sites, ordered by k means clustering of H3K9Ac signal. Each line represents a single HDAC3 binding site and the color scale indicates the H3K9Ac signal per million total reads. HDAC3 depleted liver was removed from HDAC3fl/fl mice 1 week after injection of AAV-Cre as in Methods. B. Average H3K9Ac signal from −1kb to +1kb surrounding the center of all the HDAC3 ZT10 binding sites. The Y axis represents the HDAC3 signal per million total reads. C. Heatmap of Pol II signal at ZT10 (left), and ZT22 (right) from −1kb to +1kb surrounding the TSS of genes with HDAC3 recruitment within 10 kb of the TSS, ordered by strength of Pol II binding at ZT22. Each line represents a single HDAC3 bound gene and the color scale indicates the Pol II signal per million total reads. Green marks denote 130 genes under the Gene Ontology term “Lipid Biosynthetic Process”, listed in Supp. Table 1. D. Genes up-regulated in liver depleted of HDAC3 are significantly enriched for HDAC3 binding at ZT10. Expression arrays of WT and HDAC3 KO liver were performed and analyzed as described in Methods, and the percentage of HDAC3 bound genes in each category was calculated. *p~10−156 based on hypergeometic distribution as in Methods.

