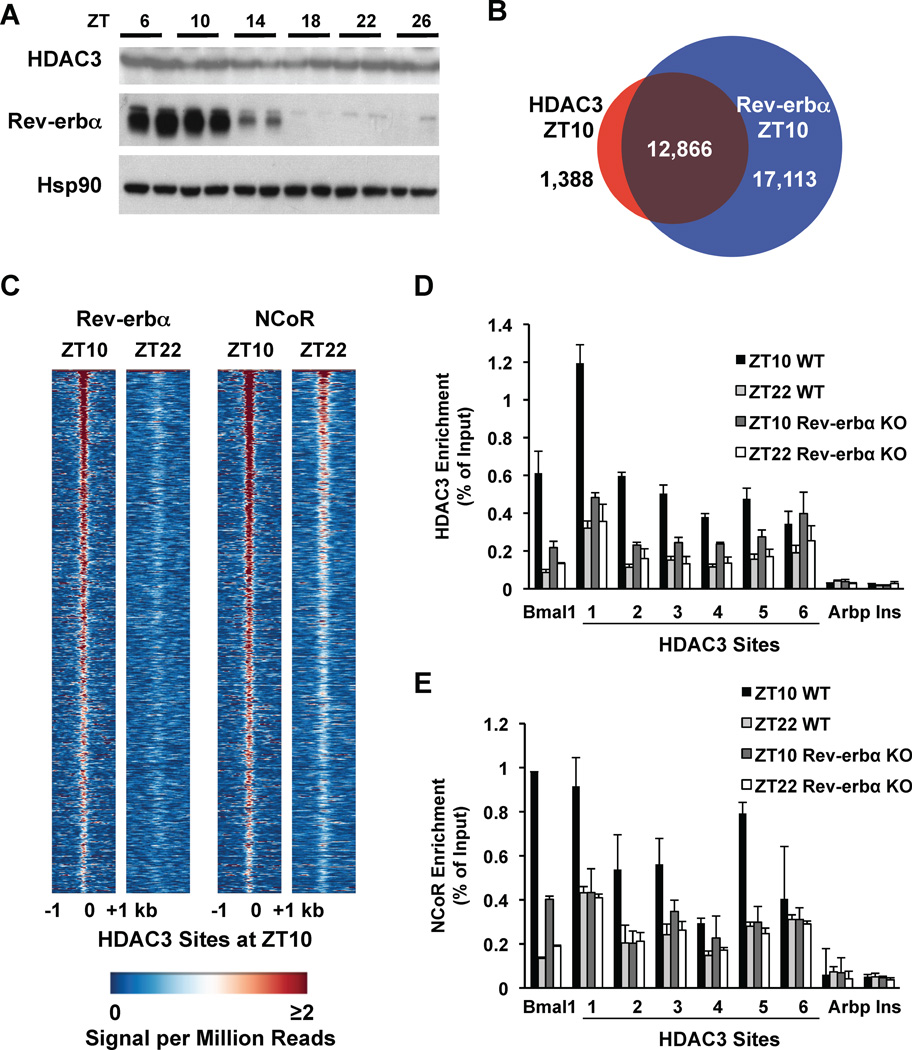
Figure 3. Recruitment of HDAC3 to the genome by Rev-erbα.
A. Immunoblot of HDAC3 and Rev-erbα over a 24h cycle in mouse liver. Hsp90 protein levels are shown as loading control. B. The HDAC3 cistrome at ZT10 largely overlaps with the Rev-erbα cistrome at ZT10. ChIP-Seq with anti-Rev-erbα antibody was performed and analyzed as described in Methods. C. Heatmap of Rev-erbα at ZT10 and ZT22 (left) and of NCoR at ZT10 and ZT22 (right), both at HDAC3 ZT10 sites ordered as in Fig. 1A. Each line represents a single HDAC3 binding site and the color scale indicates the signal per million total reads. D, E. HDAC3 (D) and NCoR (E) recruitment to six binding sites (as in Fig. 1C) were interrogated by ChIP-PCR in liver from mice lacking Rev-erbα. The Bmal1 promoter was used as a positive control (23); regions close to the TSS of the Arbp and Ins genes served as negative controls. Values are mean ± s.e.m. (n=3).

