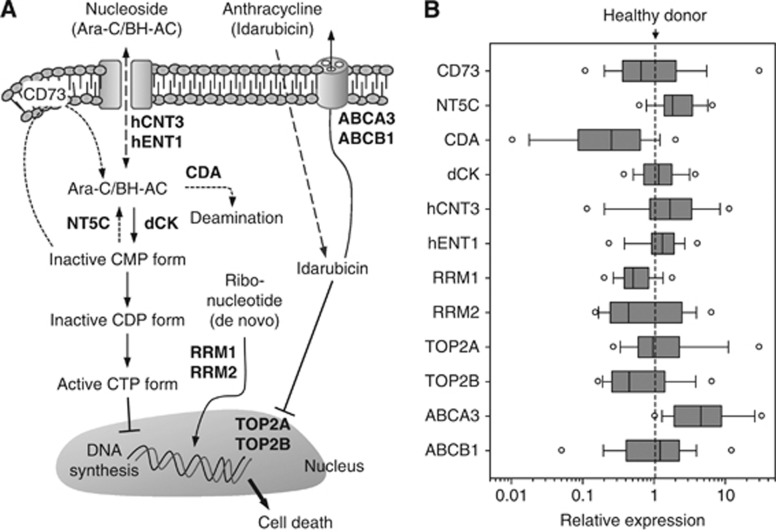
Figure 1.
Distribution of mRNA expression levels for 12 genes in 54 patients. (A) Schematic flow of therapeutic actions of nucleosides and anthracycline. Effector molecules encoded by the genes analysed in this study are marked in bold. (B) The expression of 12 candidate genes evaluated by quantitative RT–PCR. Details regarding the processes of raw data are described in the ‘Materials and Methods’ section. The final data values were expressed on log10-scale x-axis. The solid line in box plots (ranging from 25th to 75th percentile) and the circular bullets indicate the median and outlier values, respectively.

