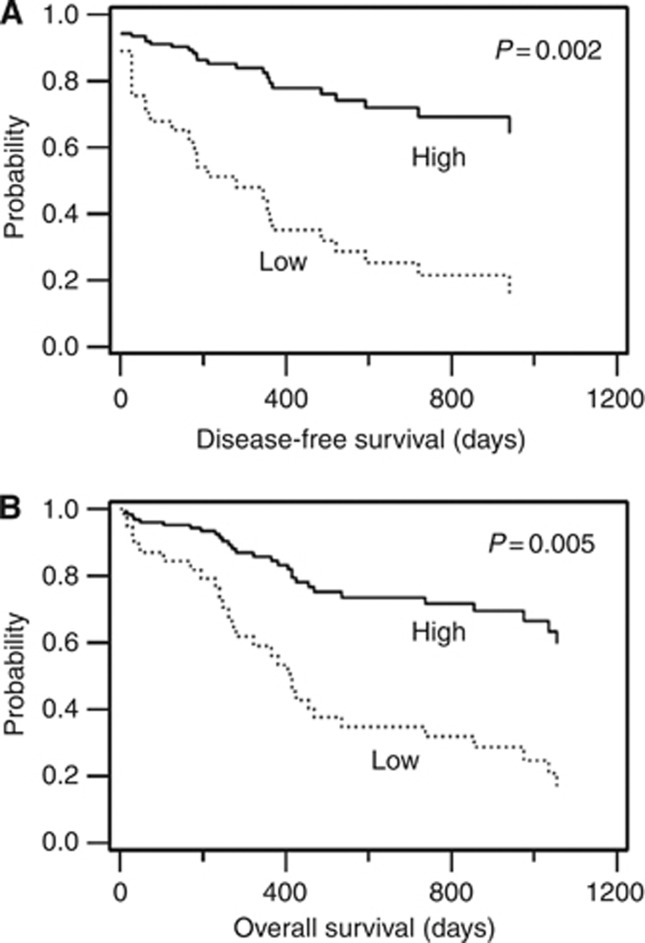
Figure 4.
Survival curves modified by the Cox proportional hazards model. A total of 54 patients were divided into low and high groups according to a reference TOP2B/TOP2A ratio of 1.0. The curves for disease-free survival (A) and overall survival (B) were rearranged from a multivariate analysis by Cox proportional hazards model via the stepwise method.

