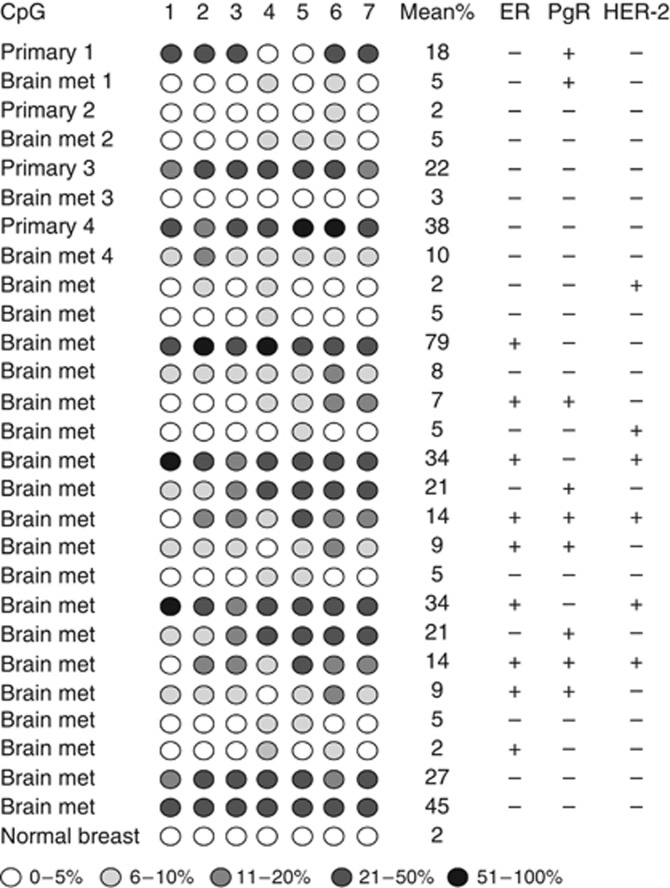
Figure 4.
Pyrosequencing analysis of NT5E CpG island in CNS metastatic breast cancer lesions. Pyrosequencing was done as described in Materials and Methods. The level of methylation is represented by the intensity of shading in the circles, each of which represents an individual CpG dinucleotide in the amplified fragment. The mean % CpG methylation in the amplified fragment together with ER, PgR and Her-2 status of the lesion are indicated. Four cases of paired primary and CNS metastatic lesions are also shown to illustrate changes in methylation.

