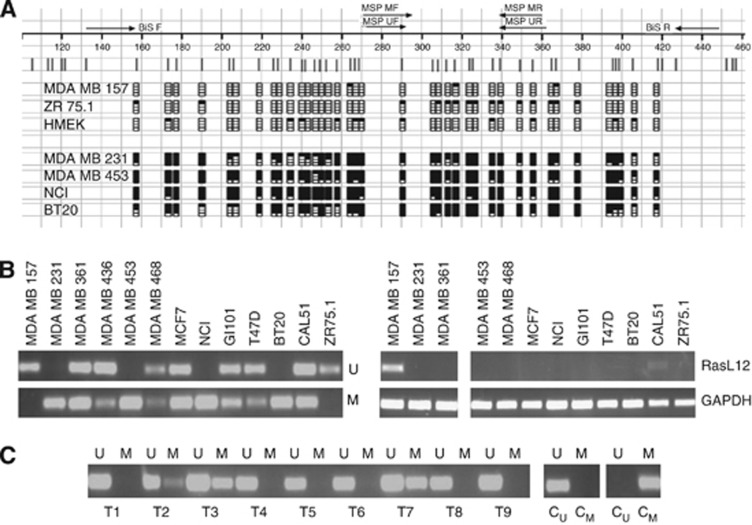
Figure 7.
Methylation-dependent transcriptional silencing of RasL12 in breast cancer. (A) Bisulphite sequencing analysis of RasL12 CpG island. The figure shows a map of the RasL12 CpG island with the position of primers indicated for bisulphite sequencing (Bis F and Bis R) and methylation-specific PCR (MSP MF, MSP UF, MSP MR and MSP UR). Vertical lines below the scale represent individual CpG dinucleotides within the CpG island. The density of methylation for each cell line is represented by a quartile of blocks corresponding to each CpG. Black shading represents up to 25% methylation. Open blocks indicate no methylation. (B) Methylation-specific PCR analysis of RasL12 CpG island methylation (left panel) and RT–PCR analysis of expression (right panel) in breast cancer cell lines. The figure shows U- and M-specific PCR reactions for each cell line and RT–PCR. (C) MSP analysis of RasL12 CpG island methylation in primary breast carcinomas from series III. Representative analysis of nine cases (T1–T9) is shown, together with control unmethylated (CU) and control methylated (CM) DNA modified and analysed in parallel with the test samples.

